2024-09-19 | Where was the most lightning in May – August?

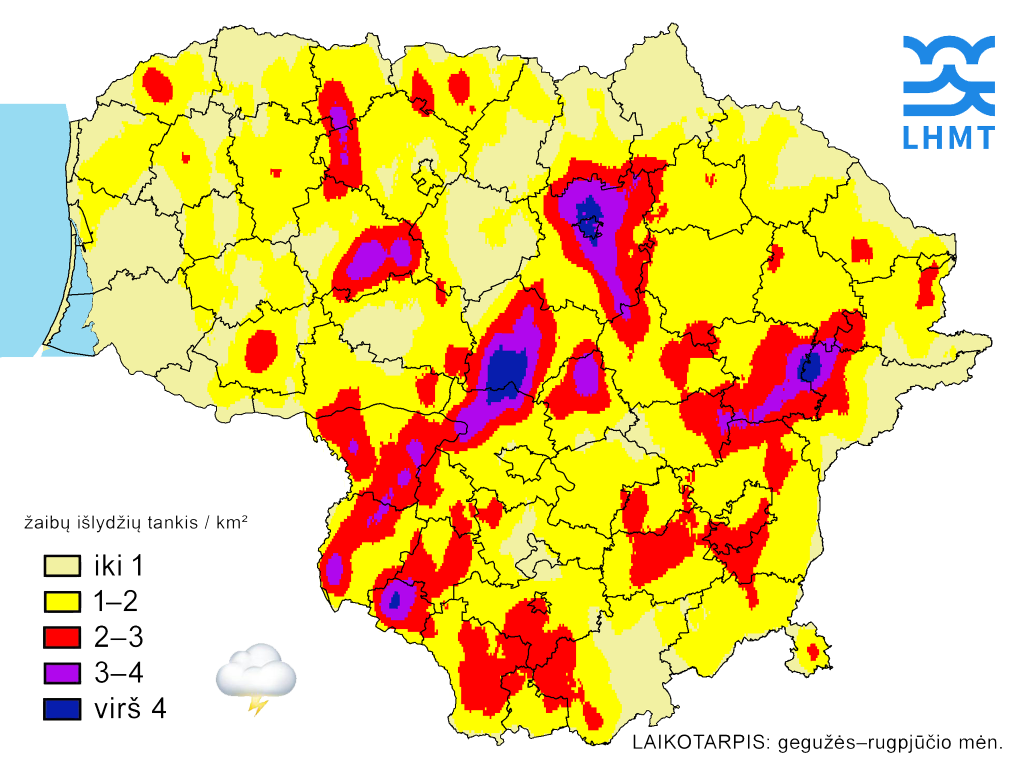
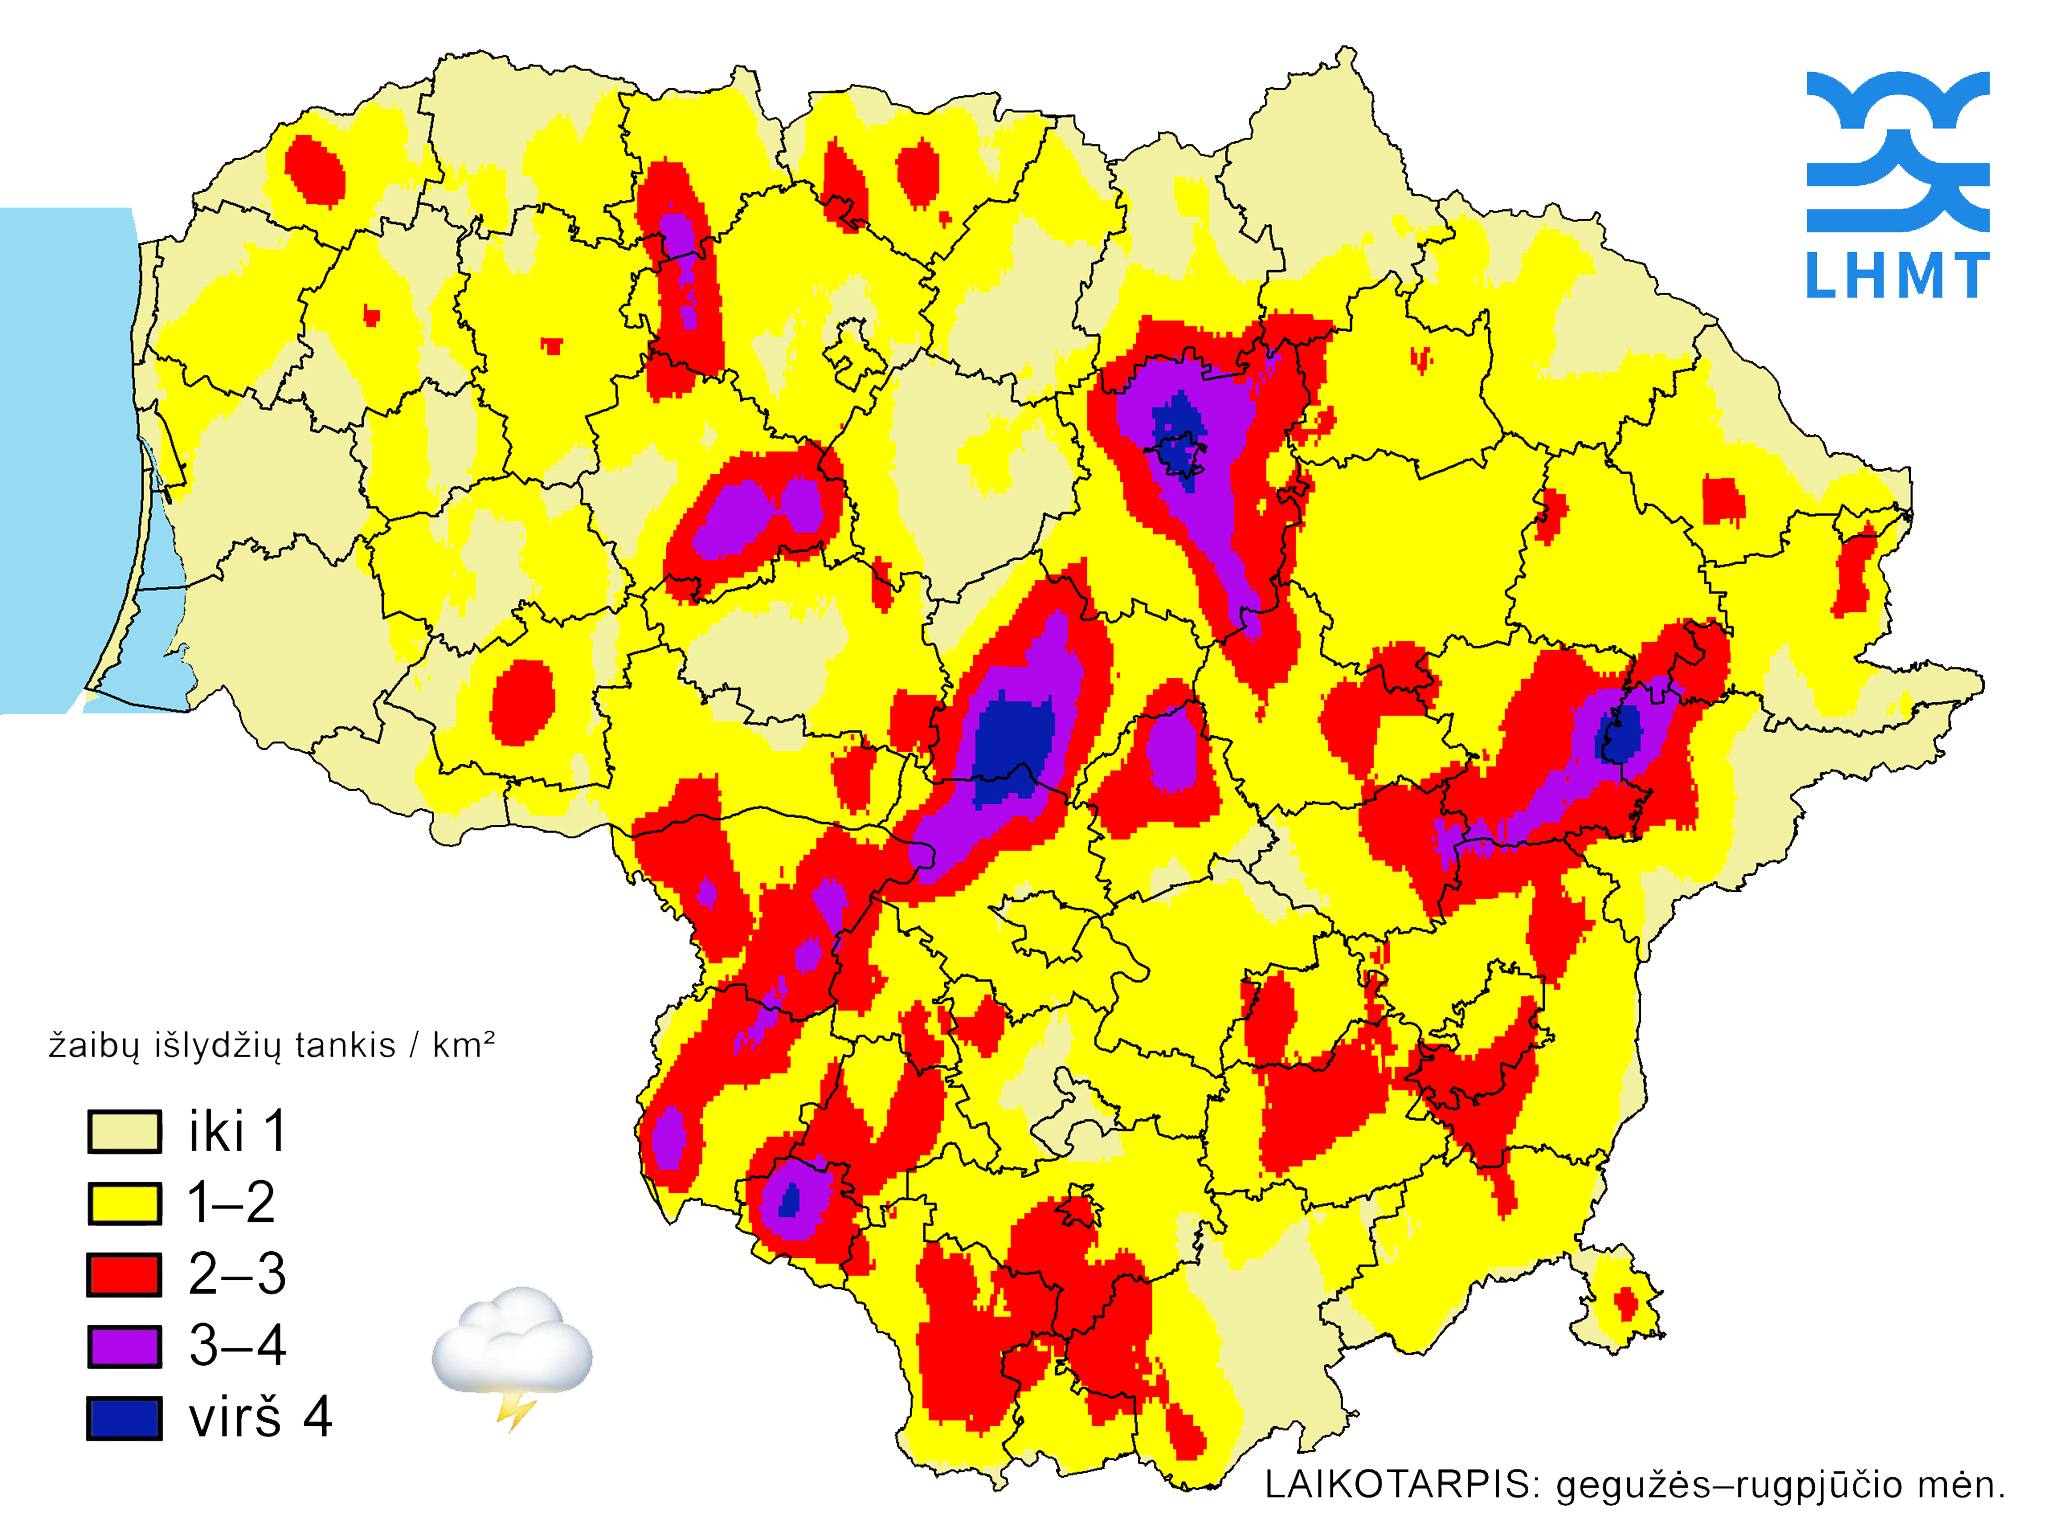
Map showing the density of recorded lightning discharges. The areas with the most lightning often coincide with areas where heavy rainfall, hail and wind gusts may have occurred.

In 4 months, out of 102,700 discharges, only 22,500 (~22%) hit the ground from the clouds. The rest of the discharges were between the clouds and did not reach the ground. The most frequent targets of lightning are overhead and underground power lines, bodies of water (lakes, rivers) and tall buildings (towers, wind turbines, etc.). The most dangerous are positive lightning discharges striking the ground from clouds. These are the ones that are most likely to strike people, grazing animals or wildlife fatally, and set forests, houses, etc. on fire. . The number of such discharges was very small – 4,517, or just 4.4% (about 1 in 23) of all recorded discharges.

The highest density of lightning discharges was recorded in the municipalities of Panevėžys Alytus, Kalvarija municipality. In Panevėžys, Kėdainiai, Šakiai and Molėtai districts there were >2.4 lightning discharges per 1 km². The least thunderstorms (i.e. the calmest) were in the seaside and coastal areas of Neringa municipality, Šilutė and Klaipėda districts and Palanga municipality (<0.8 lightning discharges/km²).
The total number of discharges in the period May-August was 102.7 thousand. The days with the most thunderstorms in this period were:

  1. 11 July – 14.7 thousand discharges;
  2. 13 July – 13 thousand discharges;
  3. 2 June – 10.1 thousand discharges;
  4. 25 May – 9.8 thousand discharges;
  5. 25 July – 5.1 thousand discharges;
  6. 29 May – 5 thousand discharges;

These six days alone account for just over half of the May-August lightning discharges. In 123 days (4 months), 41 days had no thunderstorms anywhere in the country, while another 25 days had only up to 20 discharges.

⚡️ There were 36.1 thousand lightning discharges in May;
⚡️ In June – 21.5 thousand;
⚡️ In July – 38.7 thousand;
⚡️ In August – 6.4 thousand.

Lightning detectors installed at meteorological stations in Lithuania (Biržai, Šilutė, Varėna and Raseiniai) record sky-to-ground lightning discharges and cloud-to-cloud discharges. Lightning detectors detect more than 90% of all lightning discharges within a 350 km radius. Thus, some thunderstorms go undetected (usually cloud-to-cloud discharges).


Prepared by LHMS meteorologist Gytis Valaika
2024-09-16 | International Day for the Protection of the Ozone Layer

16 September is International Day for the Protection of the Ozone Layer, to highlight the importance of the ozone layer for life on our planet. It is a good opportunity to take stock of progress and to remind us of the continuing need for action to protect this vital layer of the atmosphere.

This year’s slogan for the International Day for the Protection of the Ozone Layer is “Montreal Protocol: Advancing Climate Action” (Figure 1). The theme reflects the essential role of the Montreal Protocol not only in protecting the ozone layer, but also in advancing broader climate action initiatives worldwide. The success of this agreement inspires hope that other environmental solutions can also be achieved in a united way.

Figure 1 2024 slogan (https://ozone.unep.org/ozone-day/montreal-protocol-advancing-climate-action)

Ozone in the stratosphere acts as a natural shield, protecting the Earth from the sun’s harmful ultraviolet rays. This layer is essential not only for human health but also for the balance of ecosystems. Over the last few decades, thanks to the implementation of the Montreal Protocol and international efforts, significant progress has been made in reducing the use of ozone-depleting substances. However, challenges remain and international cooperation and the continued introduction of advanced scientific and technological solutions are essential.

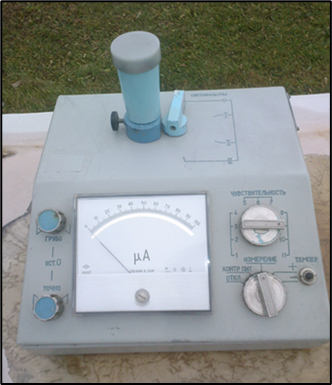
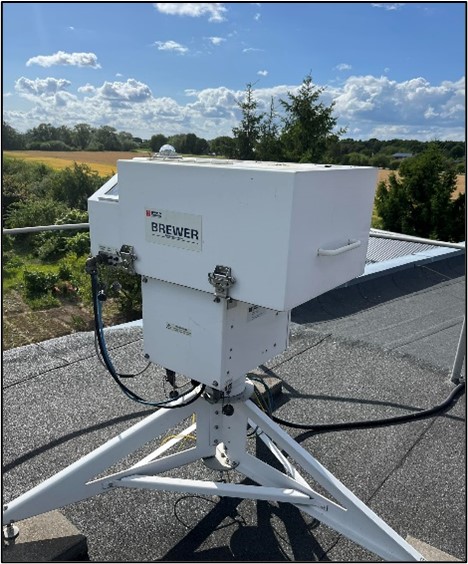
The ozone layer over Lithuania has been continuously monitored since 1993 at the Kaunas Meteorological Station (MS). Until 2018, the observations were carried out manually using a filter ozonometer (M-124) (Fig. 2), and since 2018, ozone has been measured using an automatic spectrophotometer (Brewer MK III) (Fig. 3).

Figure 2 Kaunas MS used filter ozonometer (M-124)

Figure 3 Automatic spectrophotometer (Brewer MK III) used in Kaunas MS

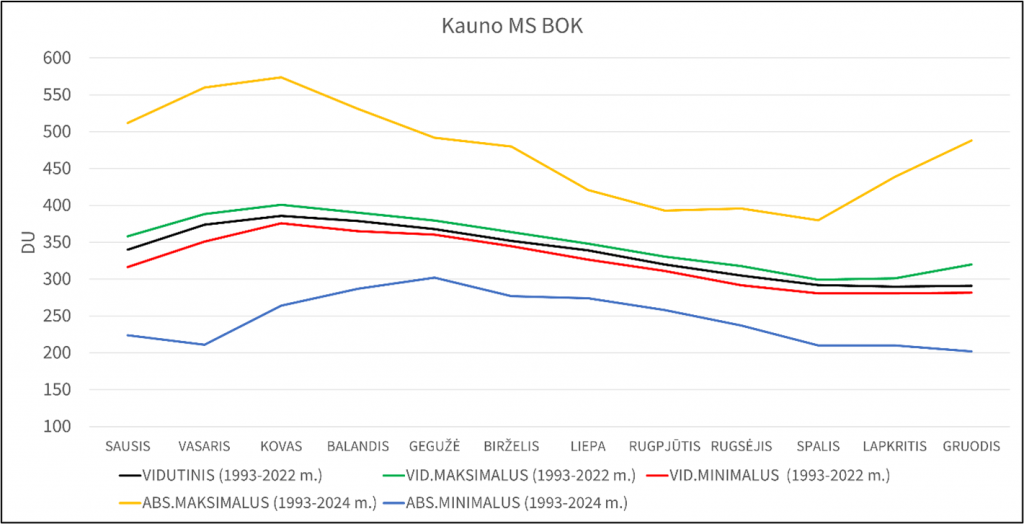
The data available from these instruments allow monitoring and analysis of the total ozone change (TOC) over Lithuania. Therefore, based on the available data, we present a brief overview of the GC  O2 in Kaunas MS. The graph shows a pronounced seasonal variation of the TOC (Figure 4). The main causes of BOK variations over Lithuania are horizontal and vertical dynamical processes in the atmosphere, latitude and seasons.  

Figure 4. Ozone in Kaunas MS

The average TOC is highest in spring and summer, peaking in March (386 DU*).In summer (June-July), the TOC gradually decreases, with the lowest values observed in autumn (October-November) and winter (December).BOK peaks are most often recorded in spring, especially in March (574 DU, 03/03/2018), while lows are recorded in December (202 DU, 21/12/2007).This is because ozone (formed here or brought in from other latitudes) accumulates during the winter because it is less destructible due to the lower altitude of the Sun, and is more destructible during the summer when the altitude of the Sun is higher and the radiation is more intense.

World Ozone Day is an important reminder of our responsibility and our shared commitment to the health and sustainability of the planet.Only by working together can we ensure that the ozone layer continues to play its important role in protecting our tomorrow and our future.

Read more about ozone here.

You can read more about how each of us can do our part to protect the ozone layer here.


*1 DU – 1/1000 cm ozone layer under normal conditions – Dobson unit.

Prepared by Gintarė Giliūtė, Chief Specialist, Meteorological and Aviation Observations Division, LHMT

2024-09-09 | Was last summer very warm?

The average summer air temperature in 2024 was as high as 18.7 degrees Celsius (compared to a long-term average of 17.3 °C; in 2023 it was 18.1 °C, in 2022 18.5 °C and in 2021 19.2 °C). It was the fourth warmest summer in Lithuania in the history of modern meteorological observations (since 1961). Only 2021 (19.2 °C), 2010 (19.0 °C) and 2002 (18.8 °C) were warmer.
Translated with DeepL.com (free version)

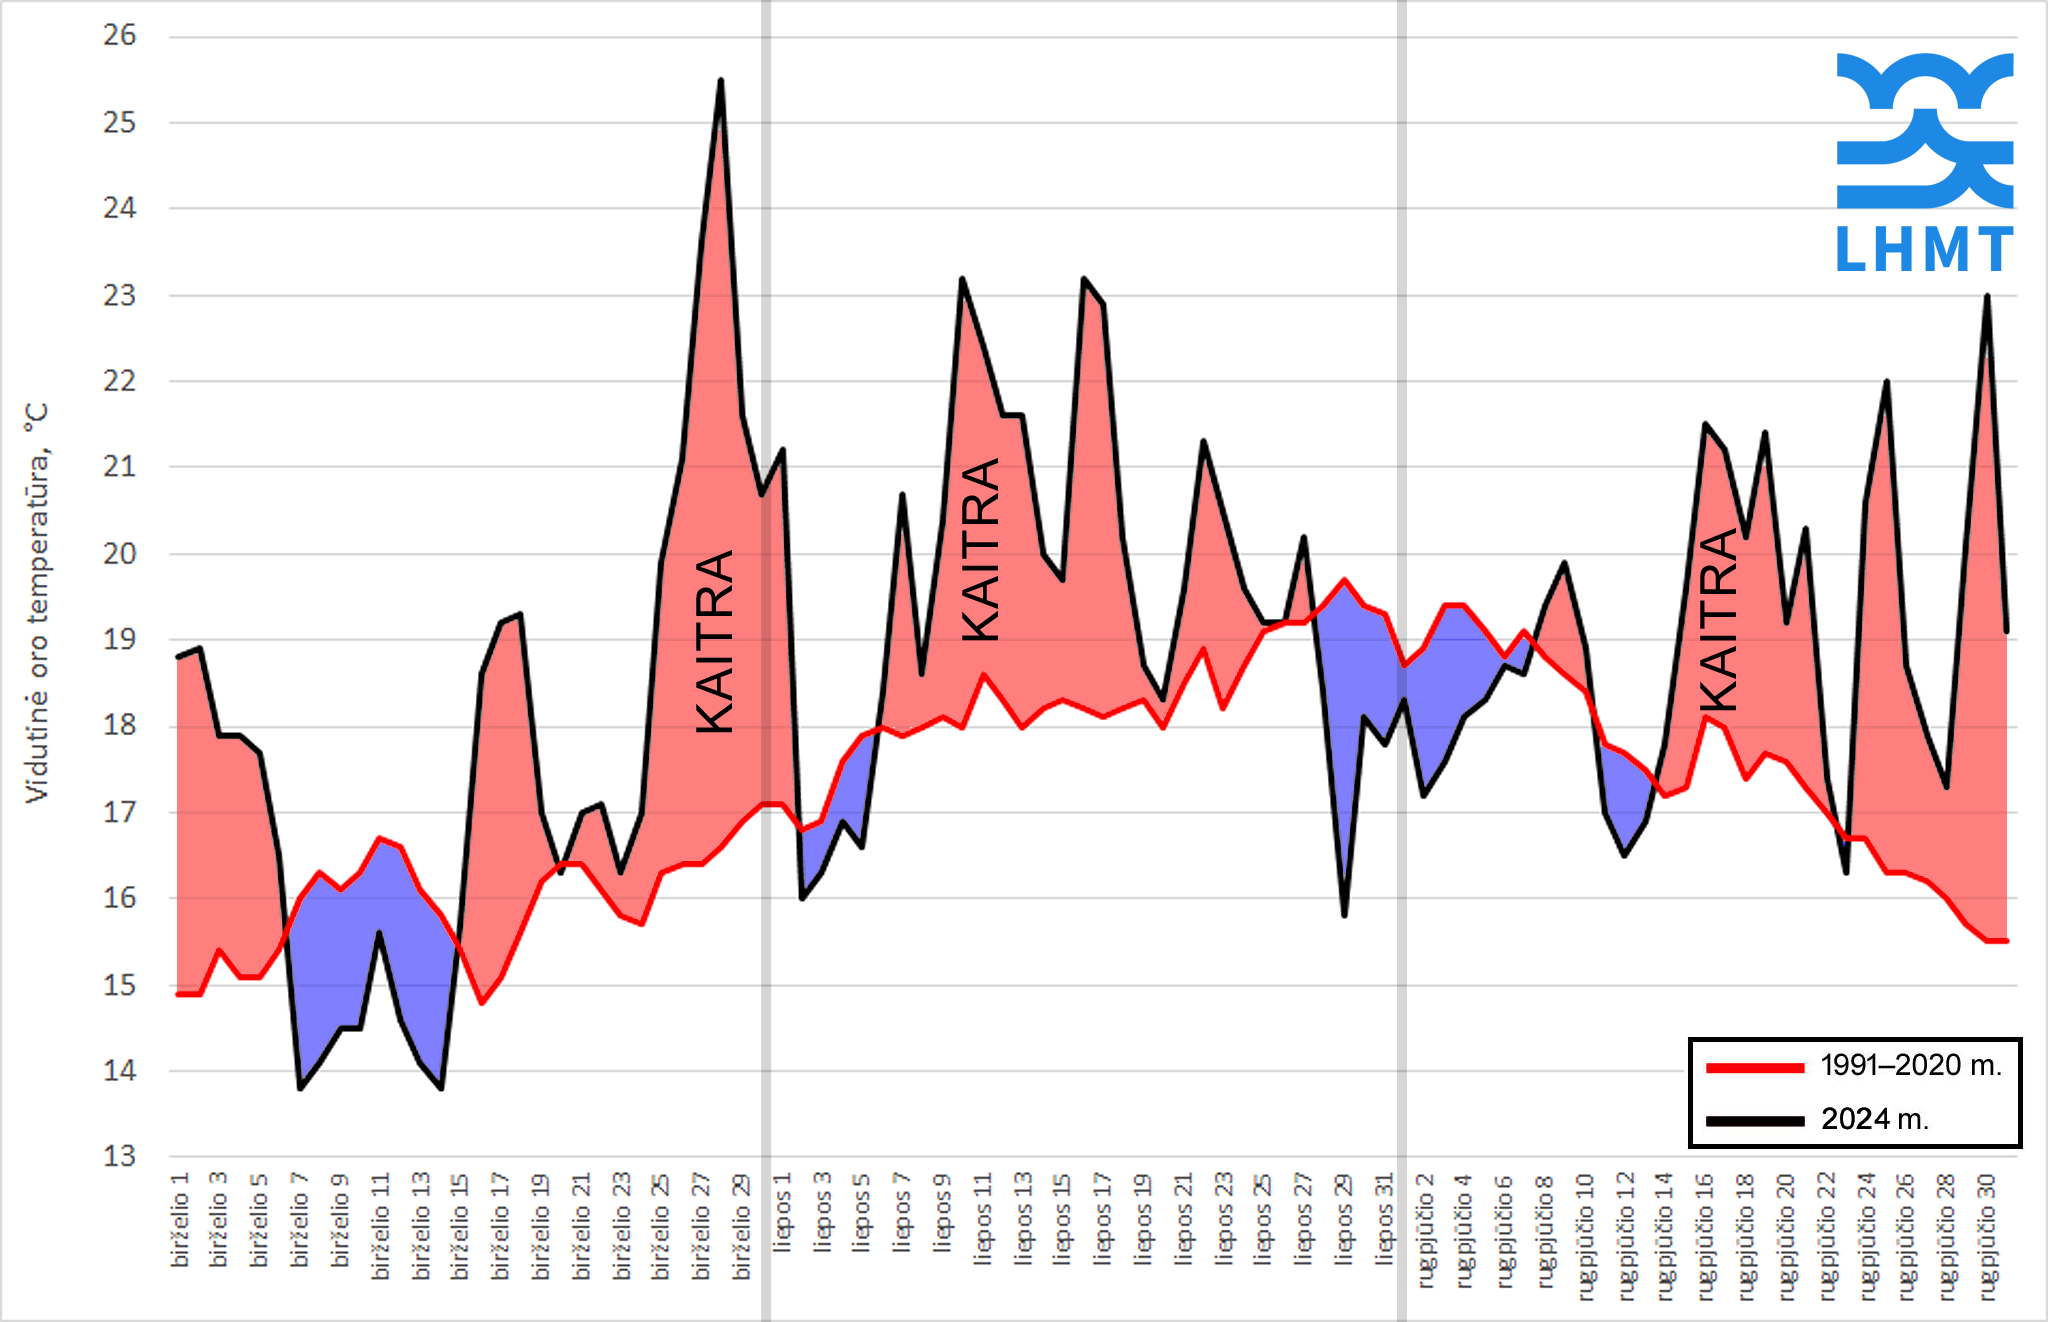
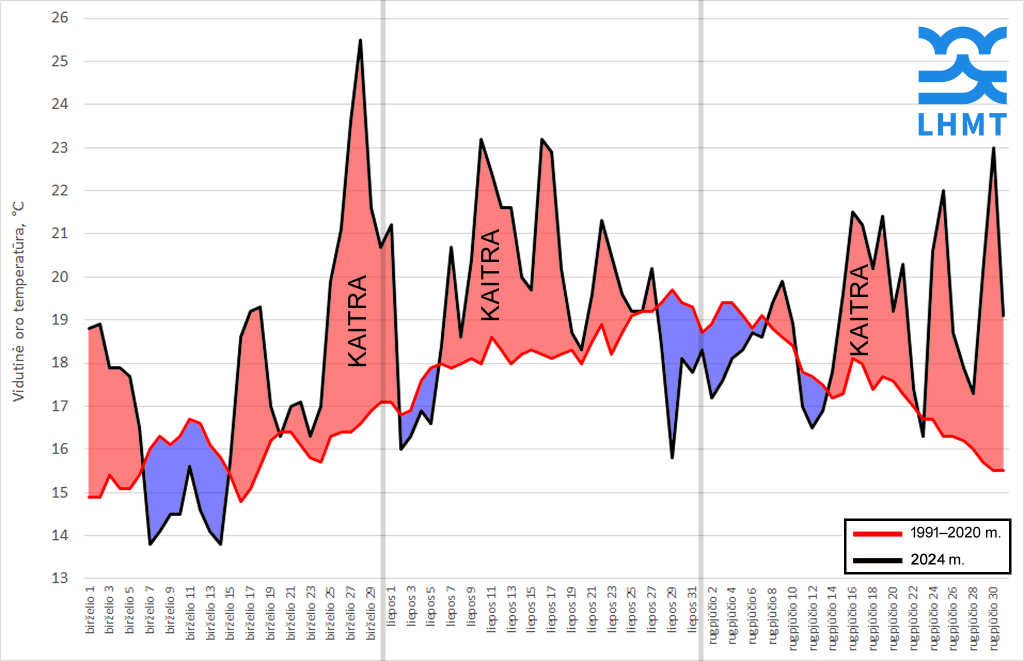
This year, the average temperature in June was 17.6 °C (17.1 °C last year), in July 19.6 °C (17.6 °C last year) and in August 19.0 °C (19.5 °C last year). Although the calendar summer was very warm overall, the averages for individual months do not give a complete picture of the past summer. You can clearly see from the graph that each month had both cooler and very warm days (the latter predominating).
Translated with DeepL.com (free version)

Of the 92 days in the calendar summer, 63 were warmer than the long-term average: 21 warm days in June, 22 in July and 20 in August.

During the summer, 28 very hot days (compared to 17 last year) were observed, with daily average temperatures ≥20 °C. On average, the hottest days were 28 June (25.5 °C) and 27 June (23.6 °C).

The graph shows the average summer air temperature in Lithuania for the period 1991-2020 and 2024.

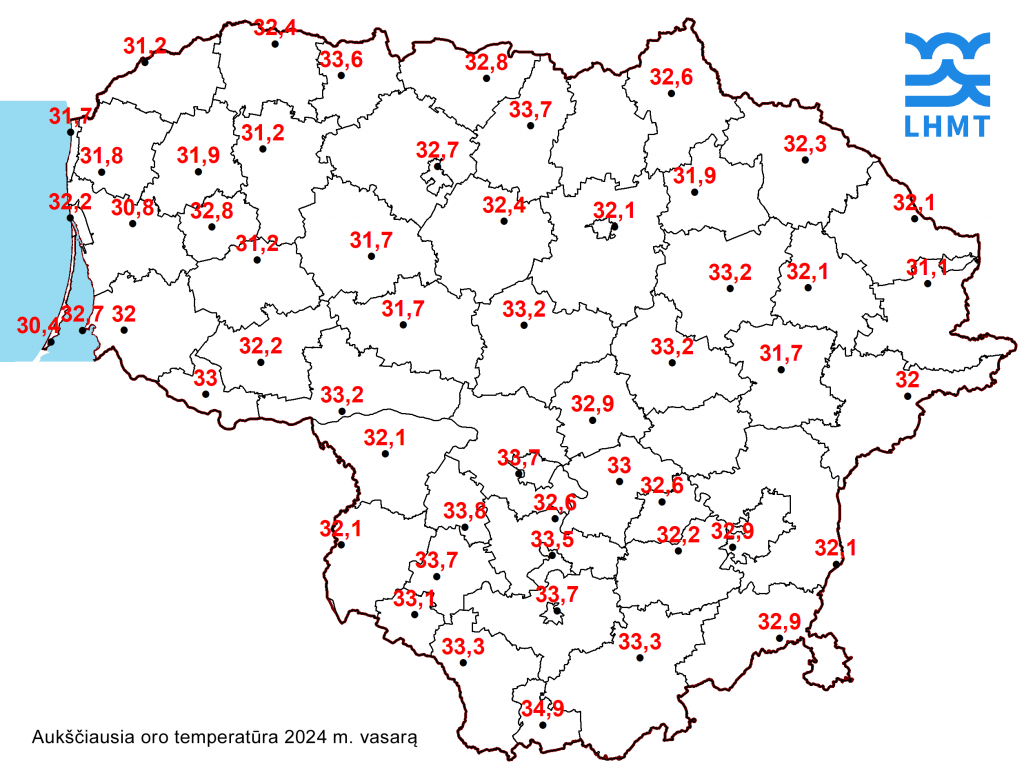
Three heatwaves were recorded during the summer (one last year): 26-28 June in Birštonas, Dotnuva, Šumsk and Varėno; 9-11 July in Marijampolė, Druskininkai and Kalvarija; 16-18 August in Alytus, Kalvarija, Lazdijai and Marijampolė. The highest air temperature this summer was measured on 11 July in Druskininkai, where the air heated up to 34.9 °C (see map below).

Map showing the highest air temperature in Lithuania in summer 2024.

Meanwhile, only 7 days were cool (8 last year), with daily average temperatures below 15 °C. The coldest days were in the first half of June.

In terms of rainfall, the summer rains were very uneven, both in terms of location and timing. Total summer rainfall in Lithuania was in line with the normal range of 225.9 mm (average for 1991-2020: 227.5 mm). Despite this, June (72% of normal) and August (49%) were dry months, while July was wet (168%; mainly due to a wind storm with heavy rain at the end of the month).

The duration of sunshine in the summer of 2024 was also in line with the norm, although it varied, as did rainfall. In Lithuania, the Sun shone for 819.3 hours, compared to a long-term average of 818 hours. In June, 103% of normal was reached, in July only 88% and in August as much as 110%.

You can read more about the summer months of 2024 here.

Prepared by LHMS meteorologist Gytis Valaika