2024-10-01 | Lithuania had the warmest September in the history of instrumental measurements

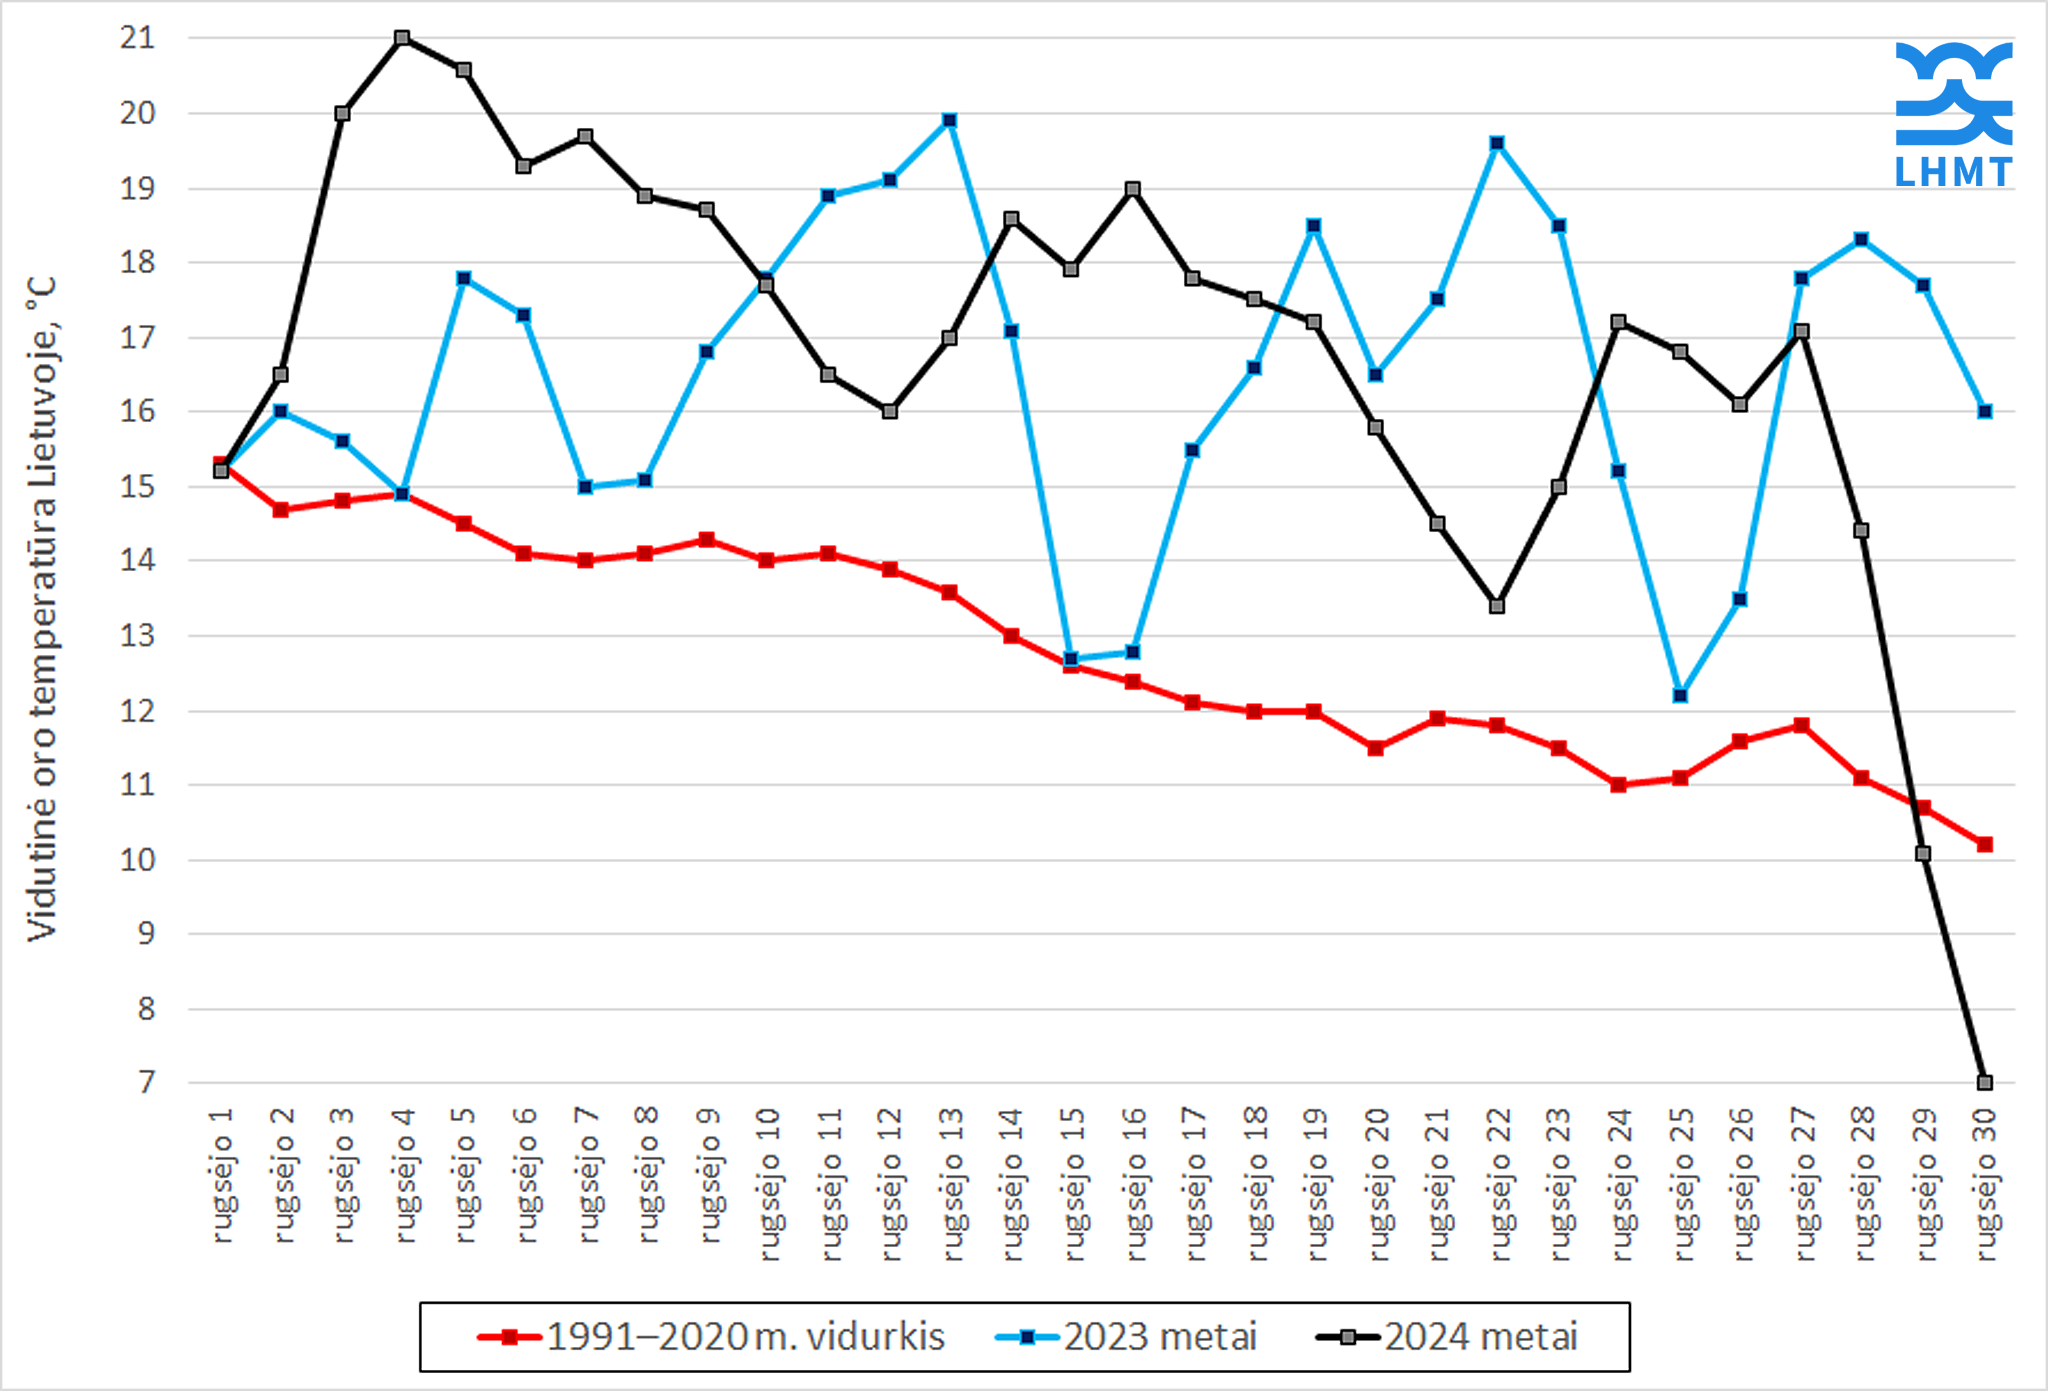
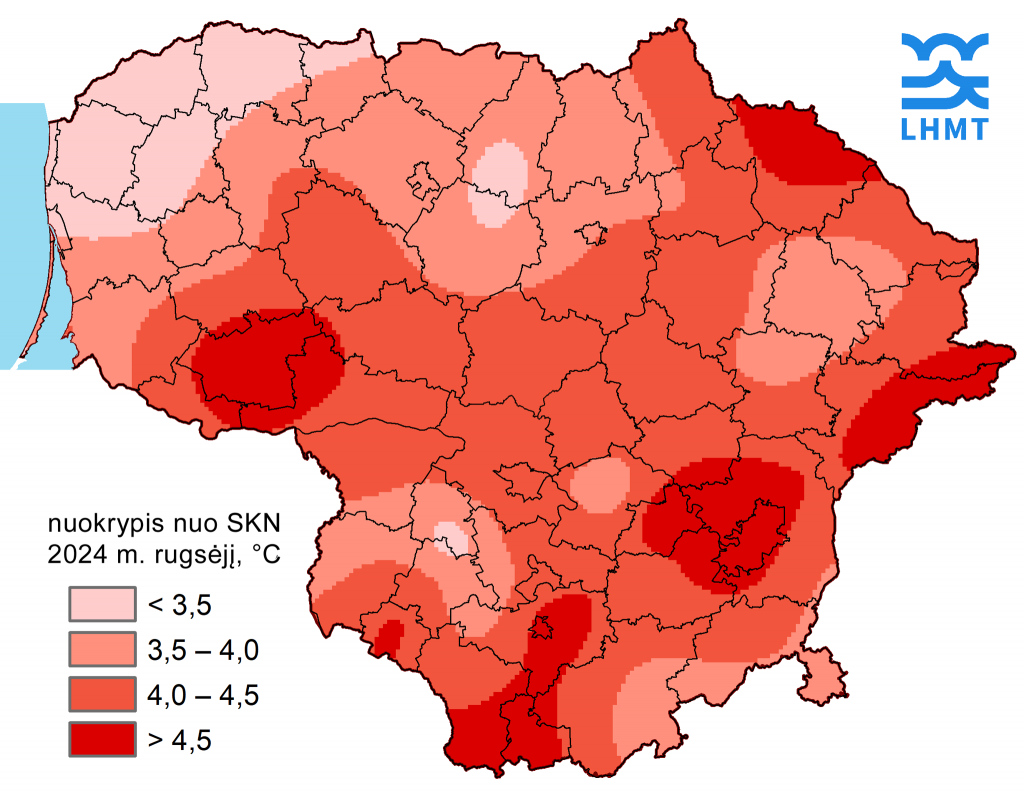
This September was the warmest in the history of instrumental observations in Lithuania (i.e. the least since 1961, and in Vilnius since 1778)! The average monthly air temperature in Lithuania was 16.8 °C (or 4 degrees warmer than average). September of 2023 (16.5 °C) was in second place, while September 1975 (14.9 °C) was in third place.

Both last year and this year, September saw no shortage of new heat records. In 2023, there were six daily maximum temperature records for the whole month, and this year there were seven more. There were also a few more days when the new record was very close to being broken.

The meteorological summer of 2023 ended late, as late as 4-5 October. And this year it ended a little earlier, on 28-29 September (or 3.5 weeks later than average). As a reminder, the average end of meteorological summer (1991-2020) is 4 September.

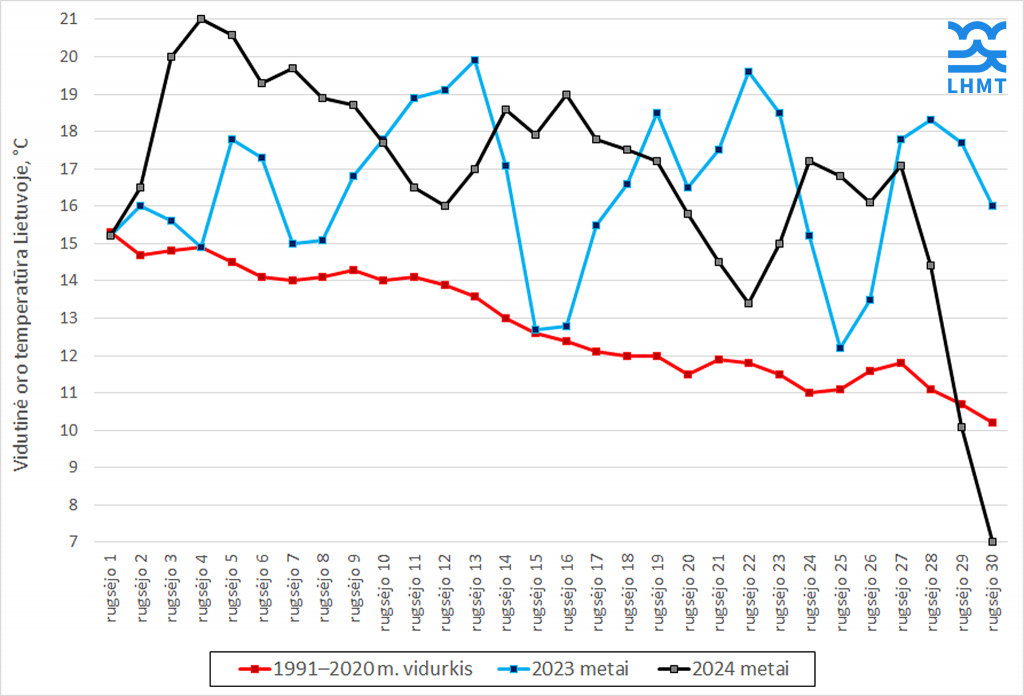
The graph shows the average air temperature in Lithuania for the period 1991-2020, in September 2023 and 2024. Note that almost all days in September 2023 and 2024 were warmer than the long-term average. Average daily air temperatures were often even in line with values for midsummer.

2024-09-19 | Where was the most lightning in May – August?

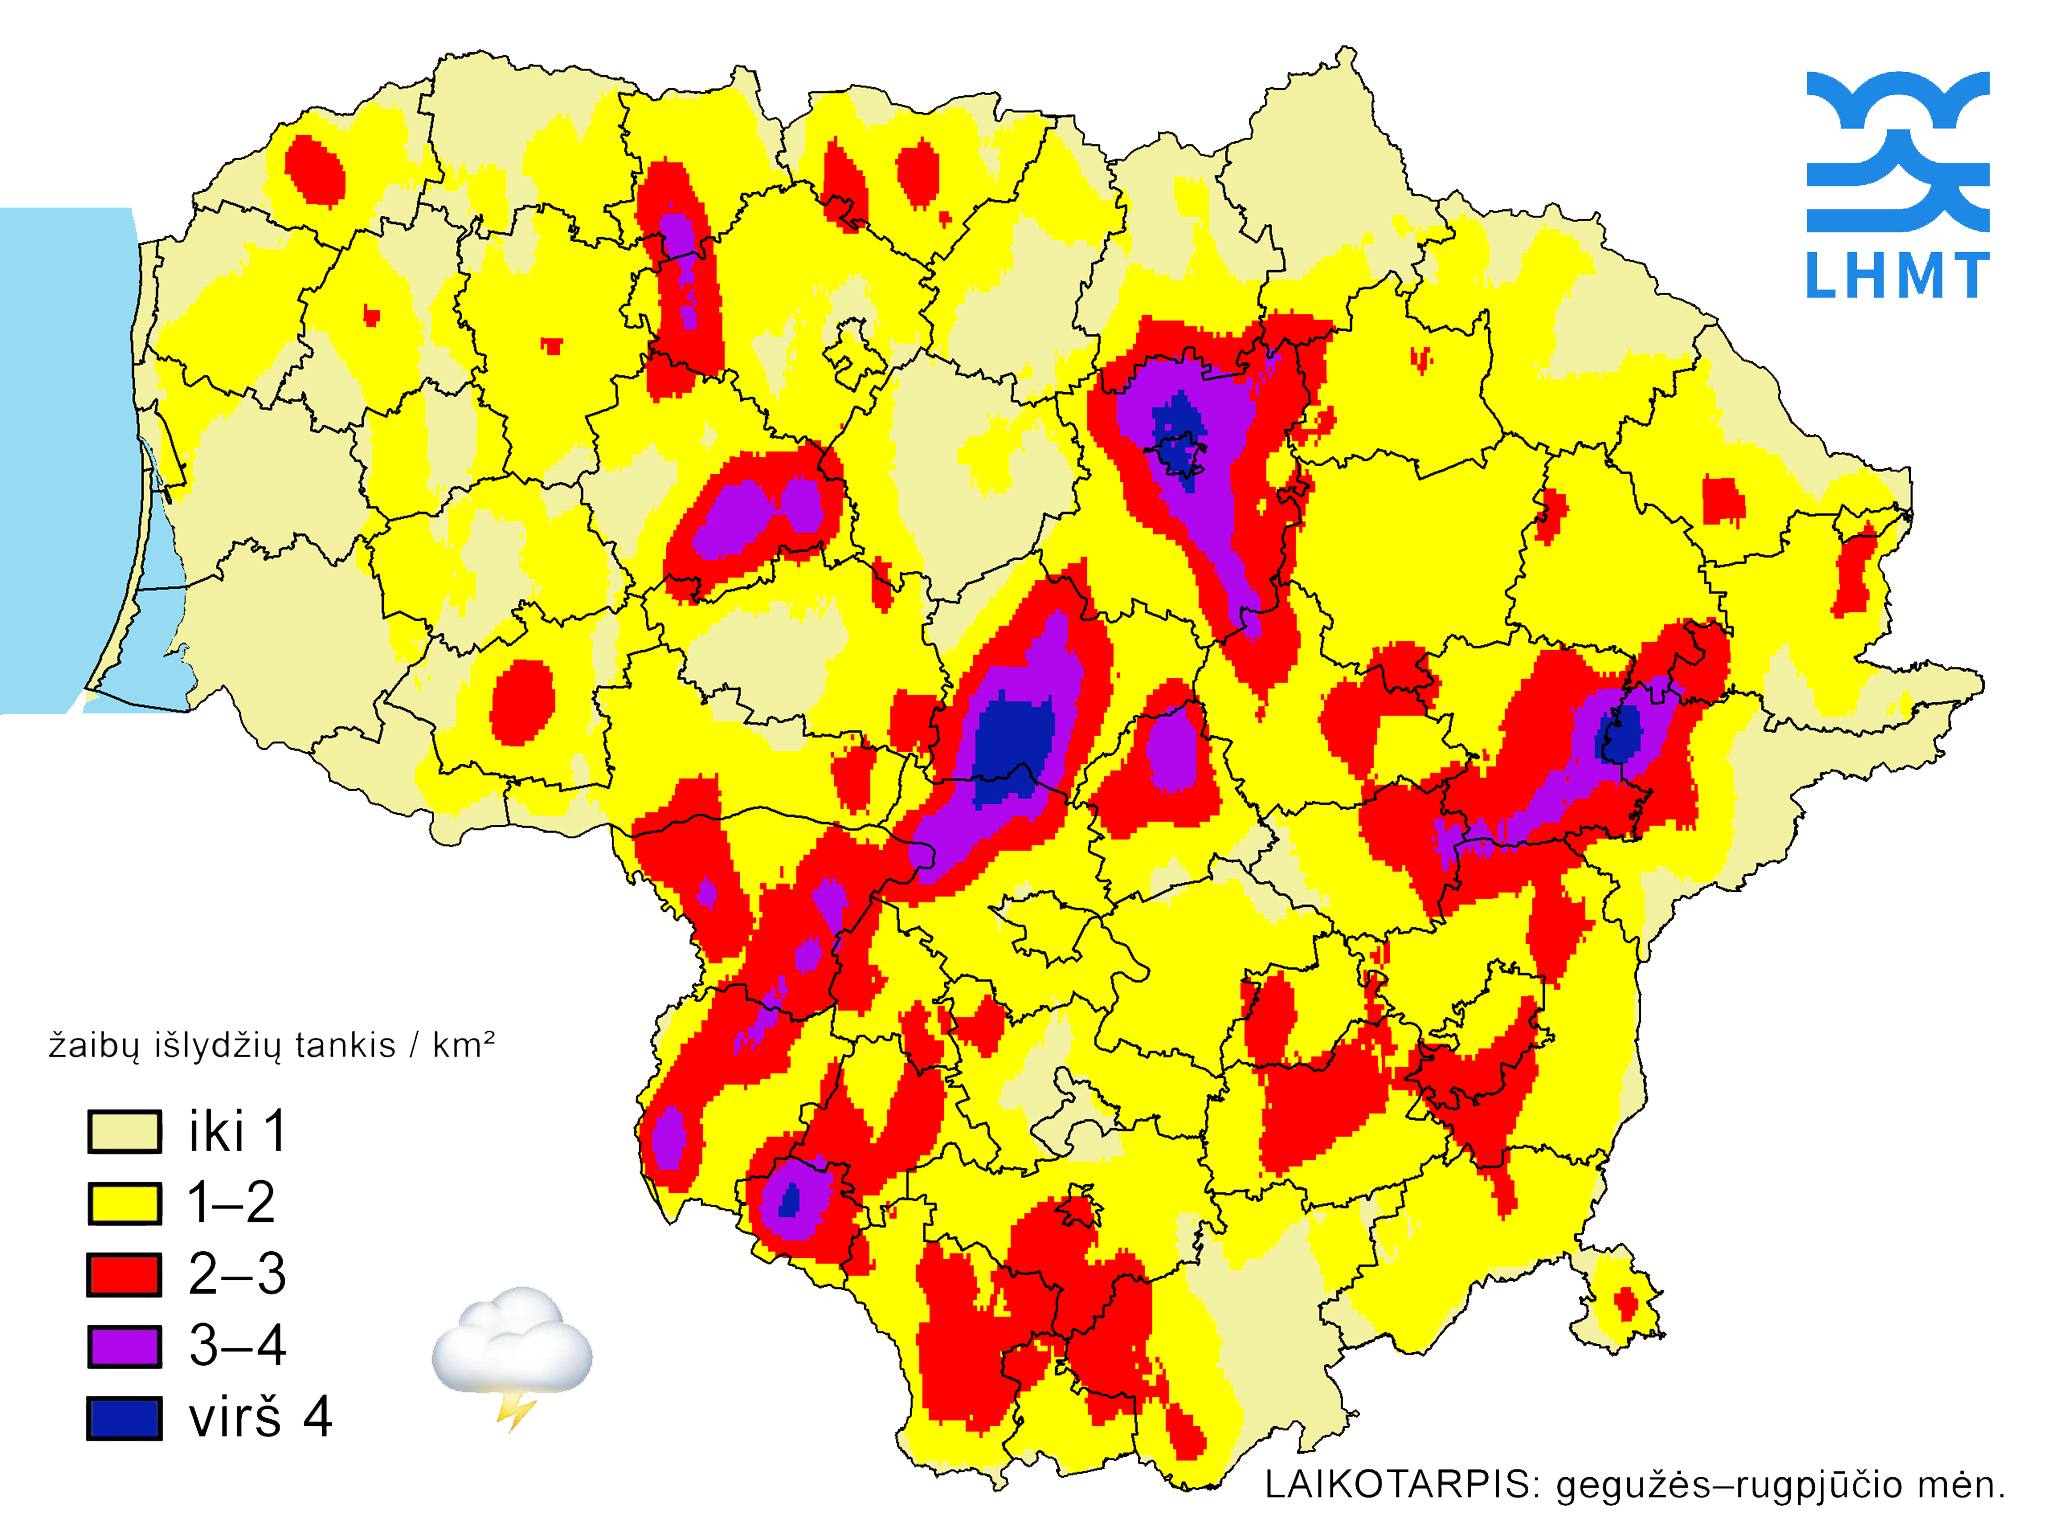
Map showing the density of recorded lightning discharges. The areas with the most lightning often coincide with areas where heavy rainfall, hail and wind gusts may have occurred.

In 4 months, out of 102,700 discharges, only 22,500 (~22%) hit the ground from the clouds. The rest of the discharges were between the clouds and did not reach the ground. The most frequent targets of lightning are overhead and underground power lines, bodies of water (lakes, rivers) and tall buildings (towers, wind turbines, etc.). The most dangerous are positive lightning discharges striking the ground from clouds. These are the ones that are most likely to strike people, grazing animals or wildlife fatally, and set forests, houses, etc. on fire. . The number of such discharges was very small – 4,517, or just 4.4% (about 1 in 23) of all recorded discharges.

The highest density of lightning discharges was recorded in the municipalities of Panevėžys Alytus, Kalvarija municipality. In Panevėžys, Kėdainiai, Šakiai and Molėtai districts there were >2.4 lightning discharges per 1 km². The least thunderstorms (i.e. the calmest) were in the seaside and coastal areas of Neringa municipality, Šilutė and Klaipėda districts and Palanga municipality (<0.8 lightning discharges/km²).

The total number of discharges in the period May-August was 102.7 thousand. The days with the most thunderstorms in this period were:

  1. 11 July – 14.7 thousand discharges;
  2. 13 July – 13 thousand discharges;
  3. 2 June – 10.1 thousand discharges;
  4. 25 May – 9.8 thousand discharges;
  5. 25 July – 5.1 thousand discharges;
  6. 29 May – 5 thousand discharges;

These six days alone account for just over half of the May-August lightning discharges. In 123 days (4 months), 41 days had no thunderstorms anywhere in the country, while another 25 days had only up to 20 discharges.

⚡️ There were 36.1 thousand lightning discharges in May;
⚡️ In June – 21.5 thousand;
⚡️ In July – 38.7 thousand;
⚡️ In August – 6.4 thousand.

Lightning detectors installed at meteorological stations in Lithuania (Biržai, Šilutė, Varėna and Raseiniai) record sky-to-ground lightning discharges and cloud-to-cloud discharges. Lightning detectors detect more than 90% of all lightning discharges within a 350 km radius. Thus, some thunderstorms go undetected (usually cloud-to-cloud discharges).


Prepared by LHMS meteorologist Gytis Valaika

2024-09-16 | International Day for the Protection of the Ozone Layer

16 September is International Day for the Protection of the Ozone Layer, to highlight the importance of the ozone layer for life on our planet. It is a good opportunity to take stock of progress and to remind us of the continuing need for action to protect this vital layer of the atmosphere.

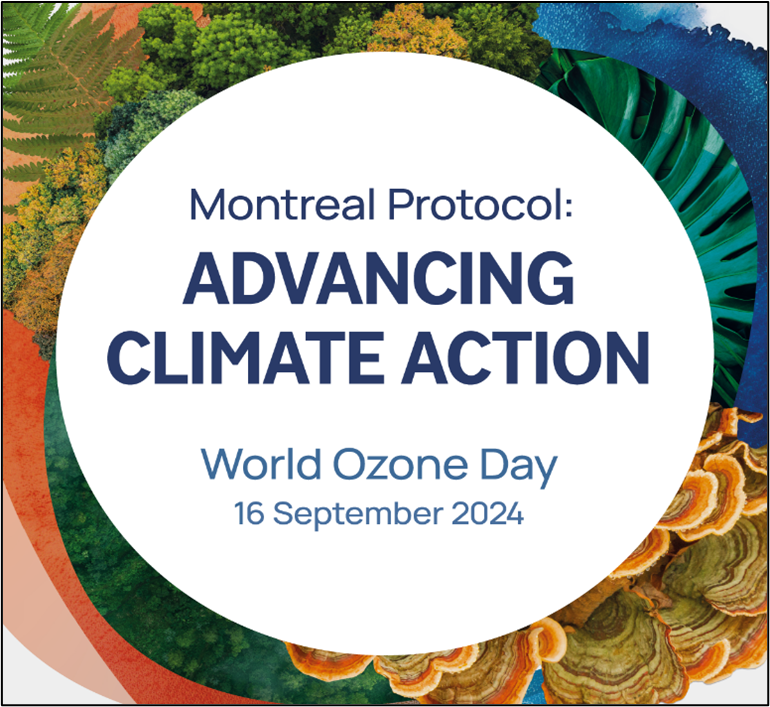
This year’s slogan for the International Day for the Protection of the Ozone Layer is “Montreal Protocol: Advancing Climate Action” (Figure 1). The theme reflects the essential role of the Montreal Protocol not only in protecting the ozone layer, but also in advancing broader climate action initiatives worldwide. The success of this agreement inspires hope that other environmental solutions can also be achieved in a united way.

Figure 1 2024 slogan (https://ozone.unep.org/ozone-day/montreal-protocol-advancing-climate-action)

Ozone in the stratosphere acts as a natural shield, protecting the Earth from the sun’s harmful ultraviolet rays. This layer is essential not only for human health but also for the balance of ecosystems. Over the last few decades, thanks to the implementation of the Montreal Protocol and international efforts, significant progress has been made in reducing the use of ozone-depleting substances. However, challenges remain and international cooperation and the continued introduction of advanced scientific and technological solutions are essential.

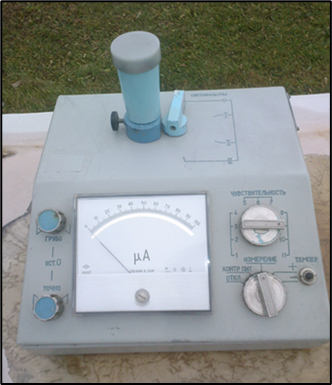
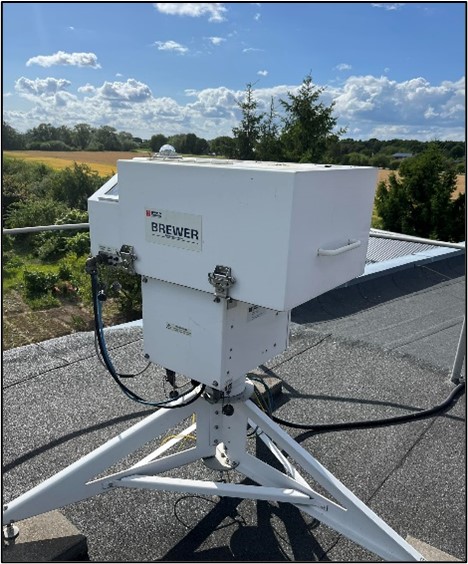
The ozone layer over Lithuania has been continuously monitored since 1993 at the Kaunas Meteorological Station (MS). Until 2018, the observations were carried out manually using a filter ozonometer (M-124) (Fig. 2), and since 2018, ozone has been measured using an automatic spectrophotometer (Brewer MK III) (Fig. 3).

Figure 2 Kaunas MS used filter ozonometer (M-124)

Figure 3 Automatic spectrophotometer (Brewer MK III) used in Kaunas MS

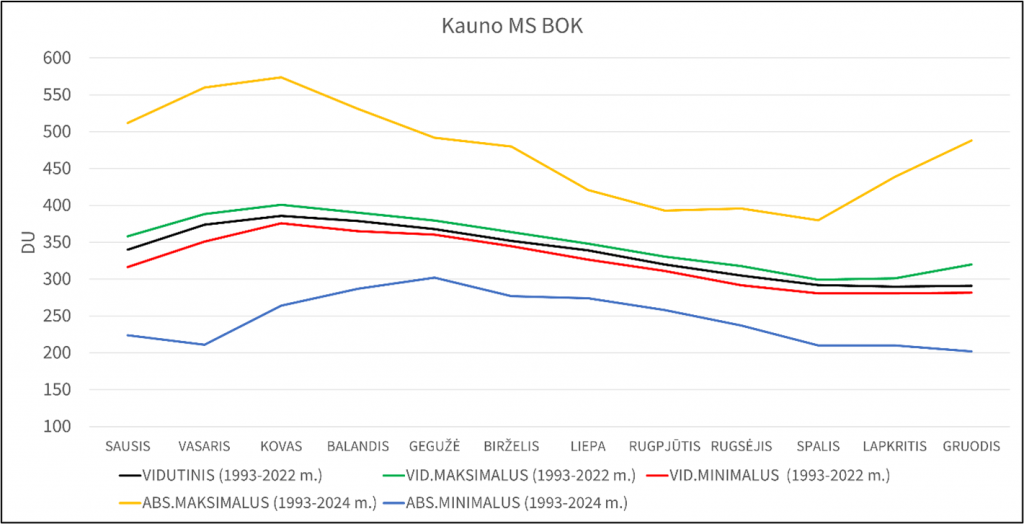
The data available from these instruments allow monitoring and analysis of the total ozone change (TOC) over Lithuania. Therefore, based on the available data, we present a brief overview of the GC  O2 in Kaunas MS. The graph shows a pronounced seasonal variation of the TOC (Figure 4). The main causes of BOK variations over Lithuania are horizontal and vertical dynamical processes in the atmosphere, latitude and seasons.  

Figure 4. Ozone in Kaunas MS

The average TOC is highest in spring and summer, peaking in March (386 DU*).In summer (June-July), the TOC gradually decreases, with the lowest values observed in autumn (October-November) and winter (December).BOK peaks are most often recorded in spring, especially in March (574 DU, 03/03/2018), while lows are recorded in December (202 DU, 21/12/2007).This is because ozone (formed here or brought in from other latitudes) accumulates during the winter because it is less destructible due to the lower altitude of the Sun, and is more destructible during the summer when the altitude of the Sun is higher and the radiation is more intense.

World Ozone Day is an important reminder of our responsibility and our shared commitment to the health and sustainability of the planet.Only by working together can we ensure that the ozone layer continues to play its important role in protecting our tomorrow and our future.

Read more about ozone here.

You can read more about how each of us can do our part to protect the ozone layer here.


*1 DU – 1/1000 cm ozone layer under normal conditions – Dobson unit.

Prepared by Gintarė Giliūtė, Chief Specialist, Meteorological and Aviation Observations Division, LHMT

2024-09-09 | Was last summer very warm?

The average summer air temperature in 2024 was as high as 18.7 degrees Celsius (compared to a long-term average of 17.3 °C; in 2023 it was 18.1 °C, in 2022 18.5 °C and in 2021 19.2 °C). It was the fourth warmest summer in Lithuania in the history of modern meteorological observations (since 1961). Only 2021 (19.2 °C), 2010 (19.0 °C) and 2002 (18.8 °C) were warmer.
Translated with DeepL.com (free version)

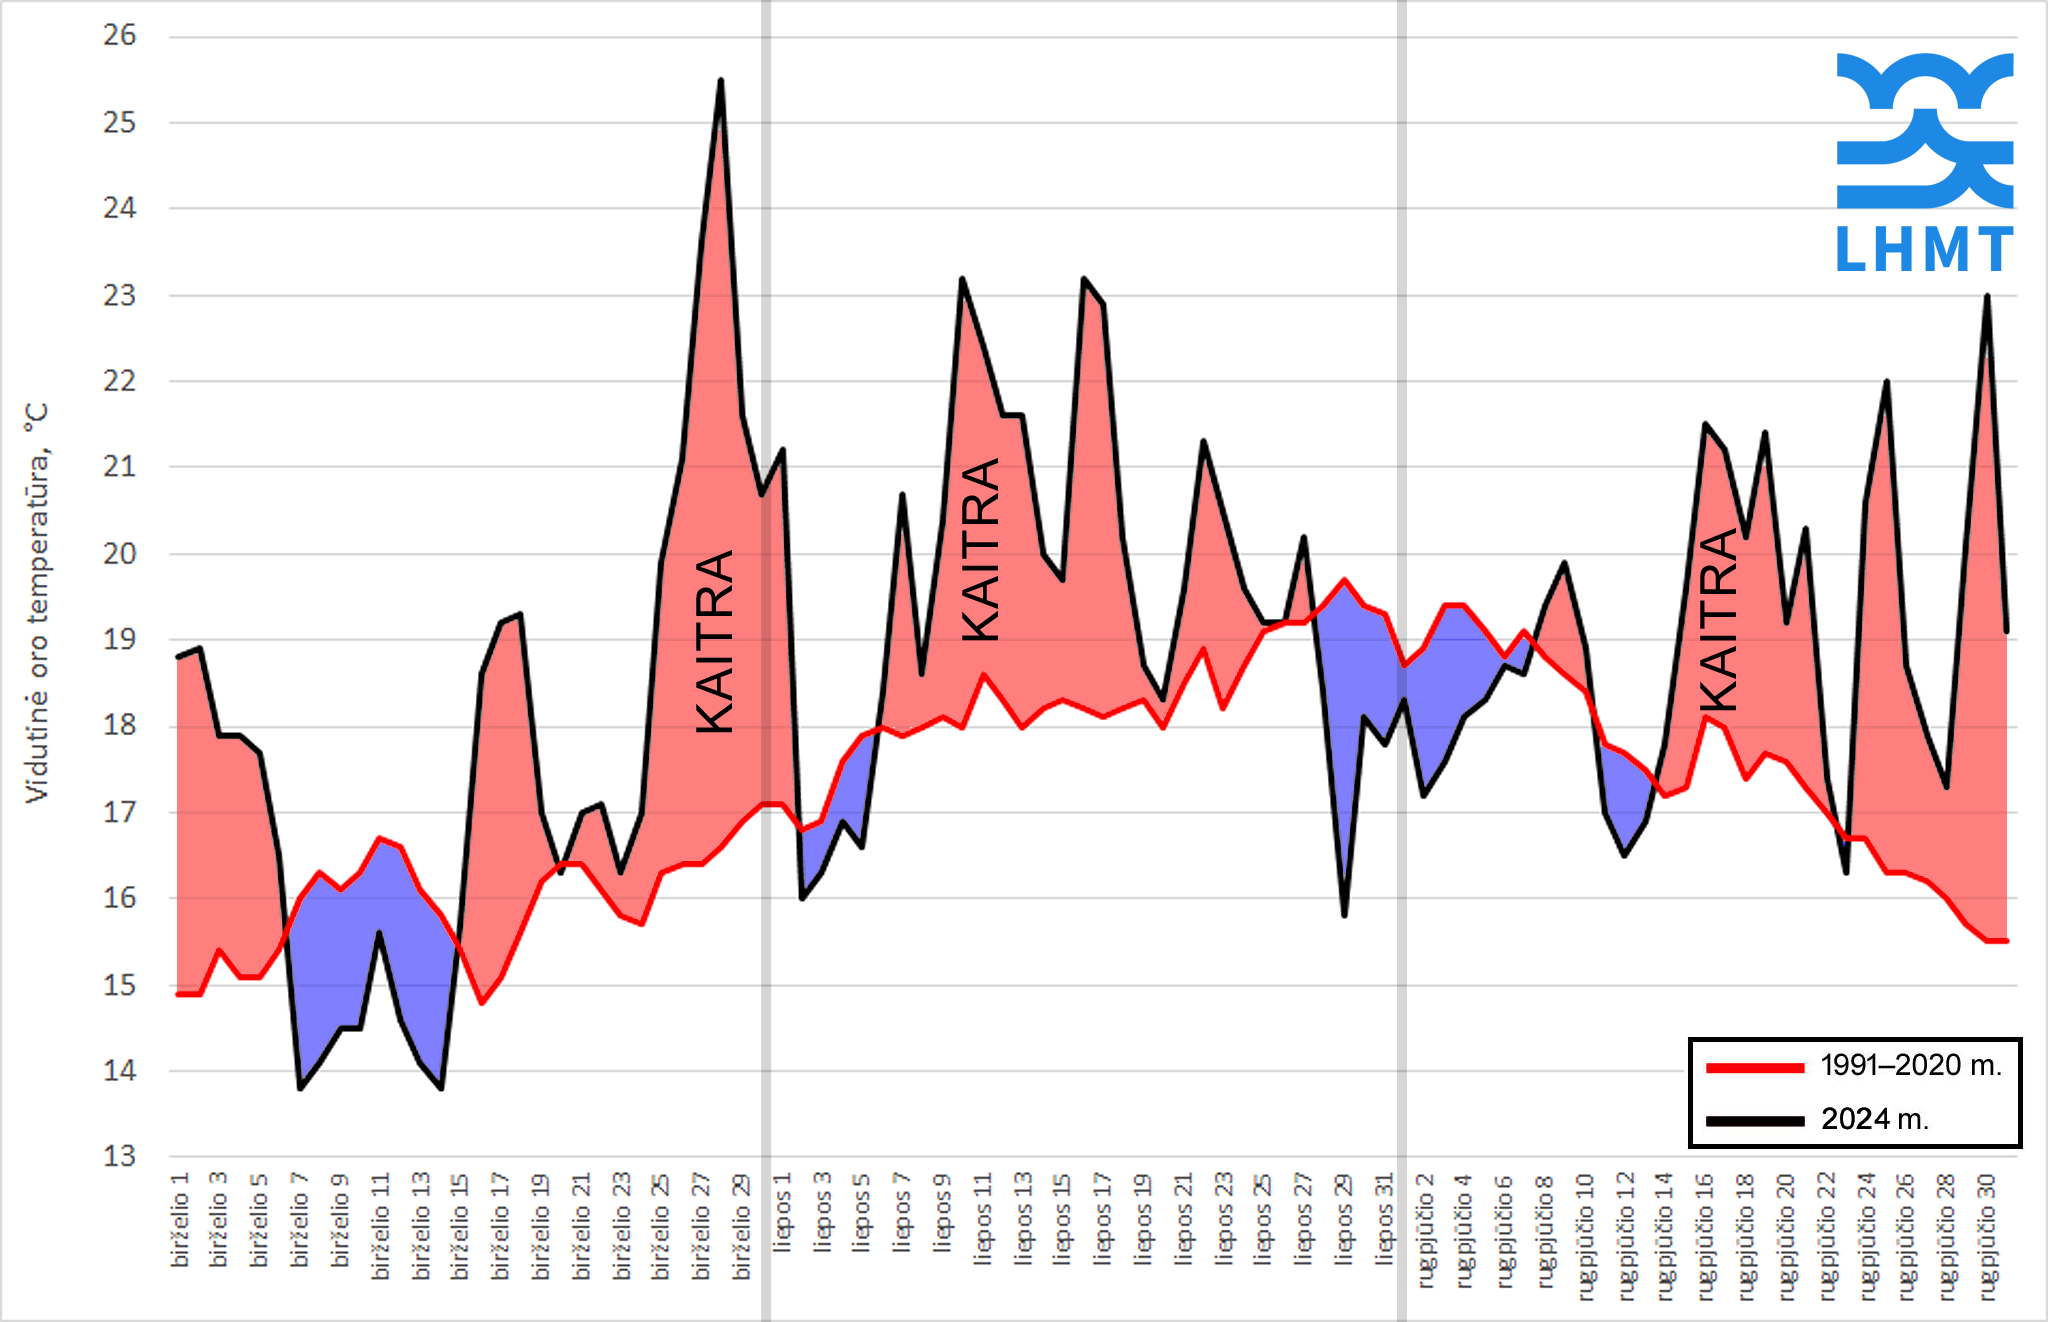
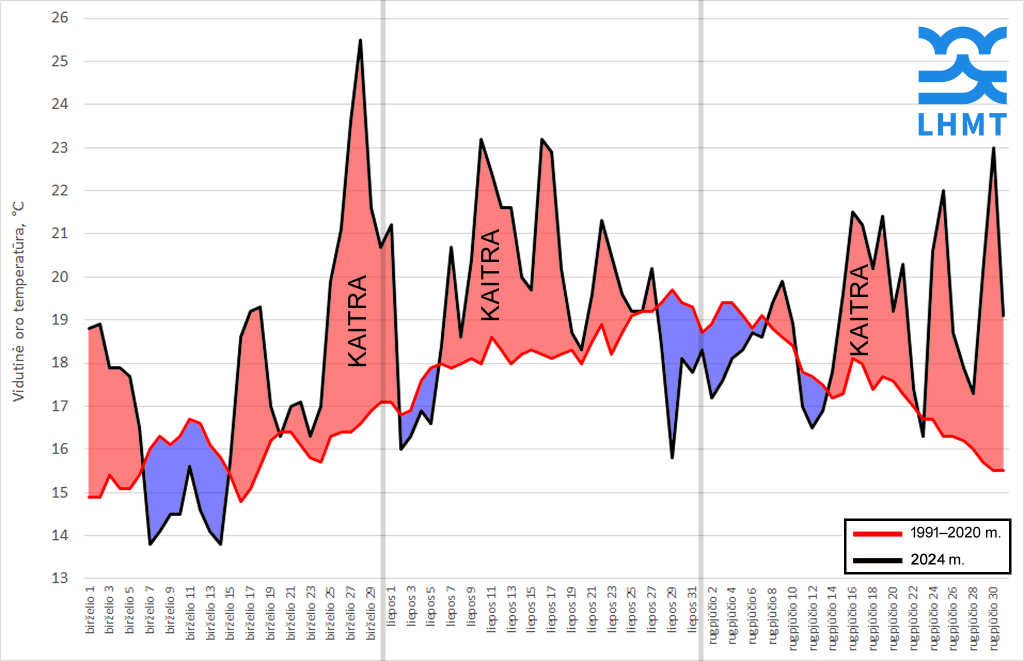
This year, the average temperature in June was 17.6 °C (17.1 °C last year), in July 19.6 °C (17.6 °C last year) and in August 19.0 °C (19.5 °C last year). Although the calendar summer was very warm overall, the averages for individual months do not give a complete picture of the past summer. You can clearly see from the graph that each month had both cooler and very warm days (the latter predominating).
Translated with DeepL.com (free version)

Of the 92 days in the calendar summer, 63 were warmer than the long-term average: 21 warm days in June, 22 in July and 20 in August.

During the summer, 28 very hot days (compared to 17 last year) were observed, with daily average temperatures ≥20 °C. On average, the hottest days were 28 June (25.5 °C) and 27 June (23.6 °C).

The graph shows the average summer air temperature in Lithuania for the period 1991-2020 and 2024.

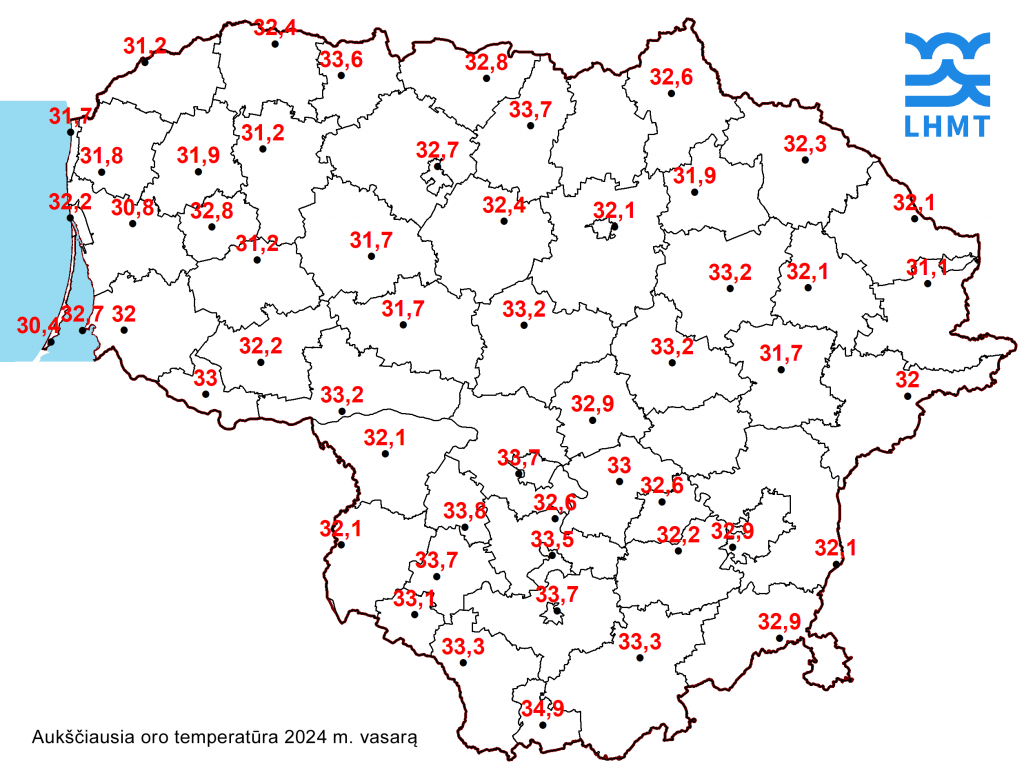
Three heatwaves were recorded during the summer (one last year): 26-28 June in Birštonas, Dotnuva, Šumsk and Varėno; 9-11 July in Marijampolė, Druskininkai and Kalvarija; 16-18 August in Alytus, Kalvarija, Lazdijai and Marijampolė. The highest air temperature this summer was measured on 11 July in Druskininkai, where the air heated up to 34.9 °C (see map below).

Map showing the highest air temperature in Lithuania in summer 2024.

Meanwhile, only 7 days were cool (8 last year), with daily average temperatures below 15 °C. The coldest days were in the first half of June.

In terms of rainfall, the summer rains were very uneven, both in terms of location and timing. Total summer rainfall in Lithuania was in line with the normal range of 225.9 mm (average for 1991-2020: 227.5 mm). Despite this, June (72% of normal) and August (49%) were dry months, while July was wet (168%; mainly due to a wind storm with heavy rain at the end of the month).

The duration of sunshine in the summer of 2024 was also in line with the norm, although it varied, as did rainfall. In Lithuania, the Sun shone for 819.3 hours, compared to a long-term average of 818 hours. In June, 103% of normal was reached, in July only 88% and in August as much as 110%.

You can read more about the summer months of 2024 here.

Prepared by LHMS meteorologist Gytis Valaika

2024-07-30 | On the extreme rain on 28-29 July

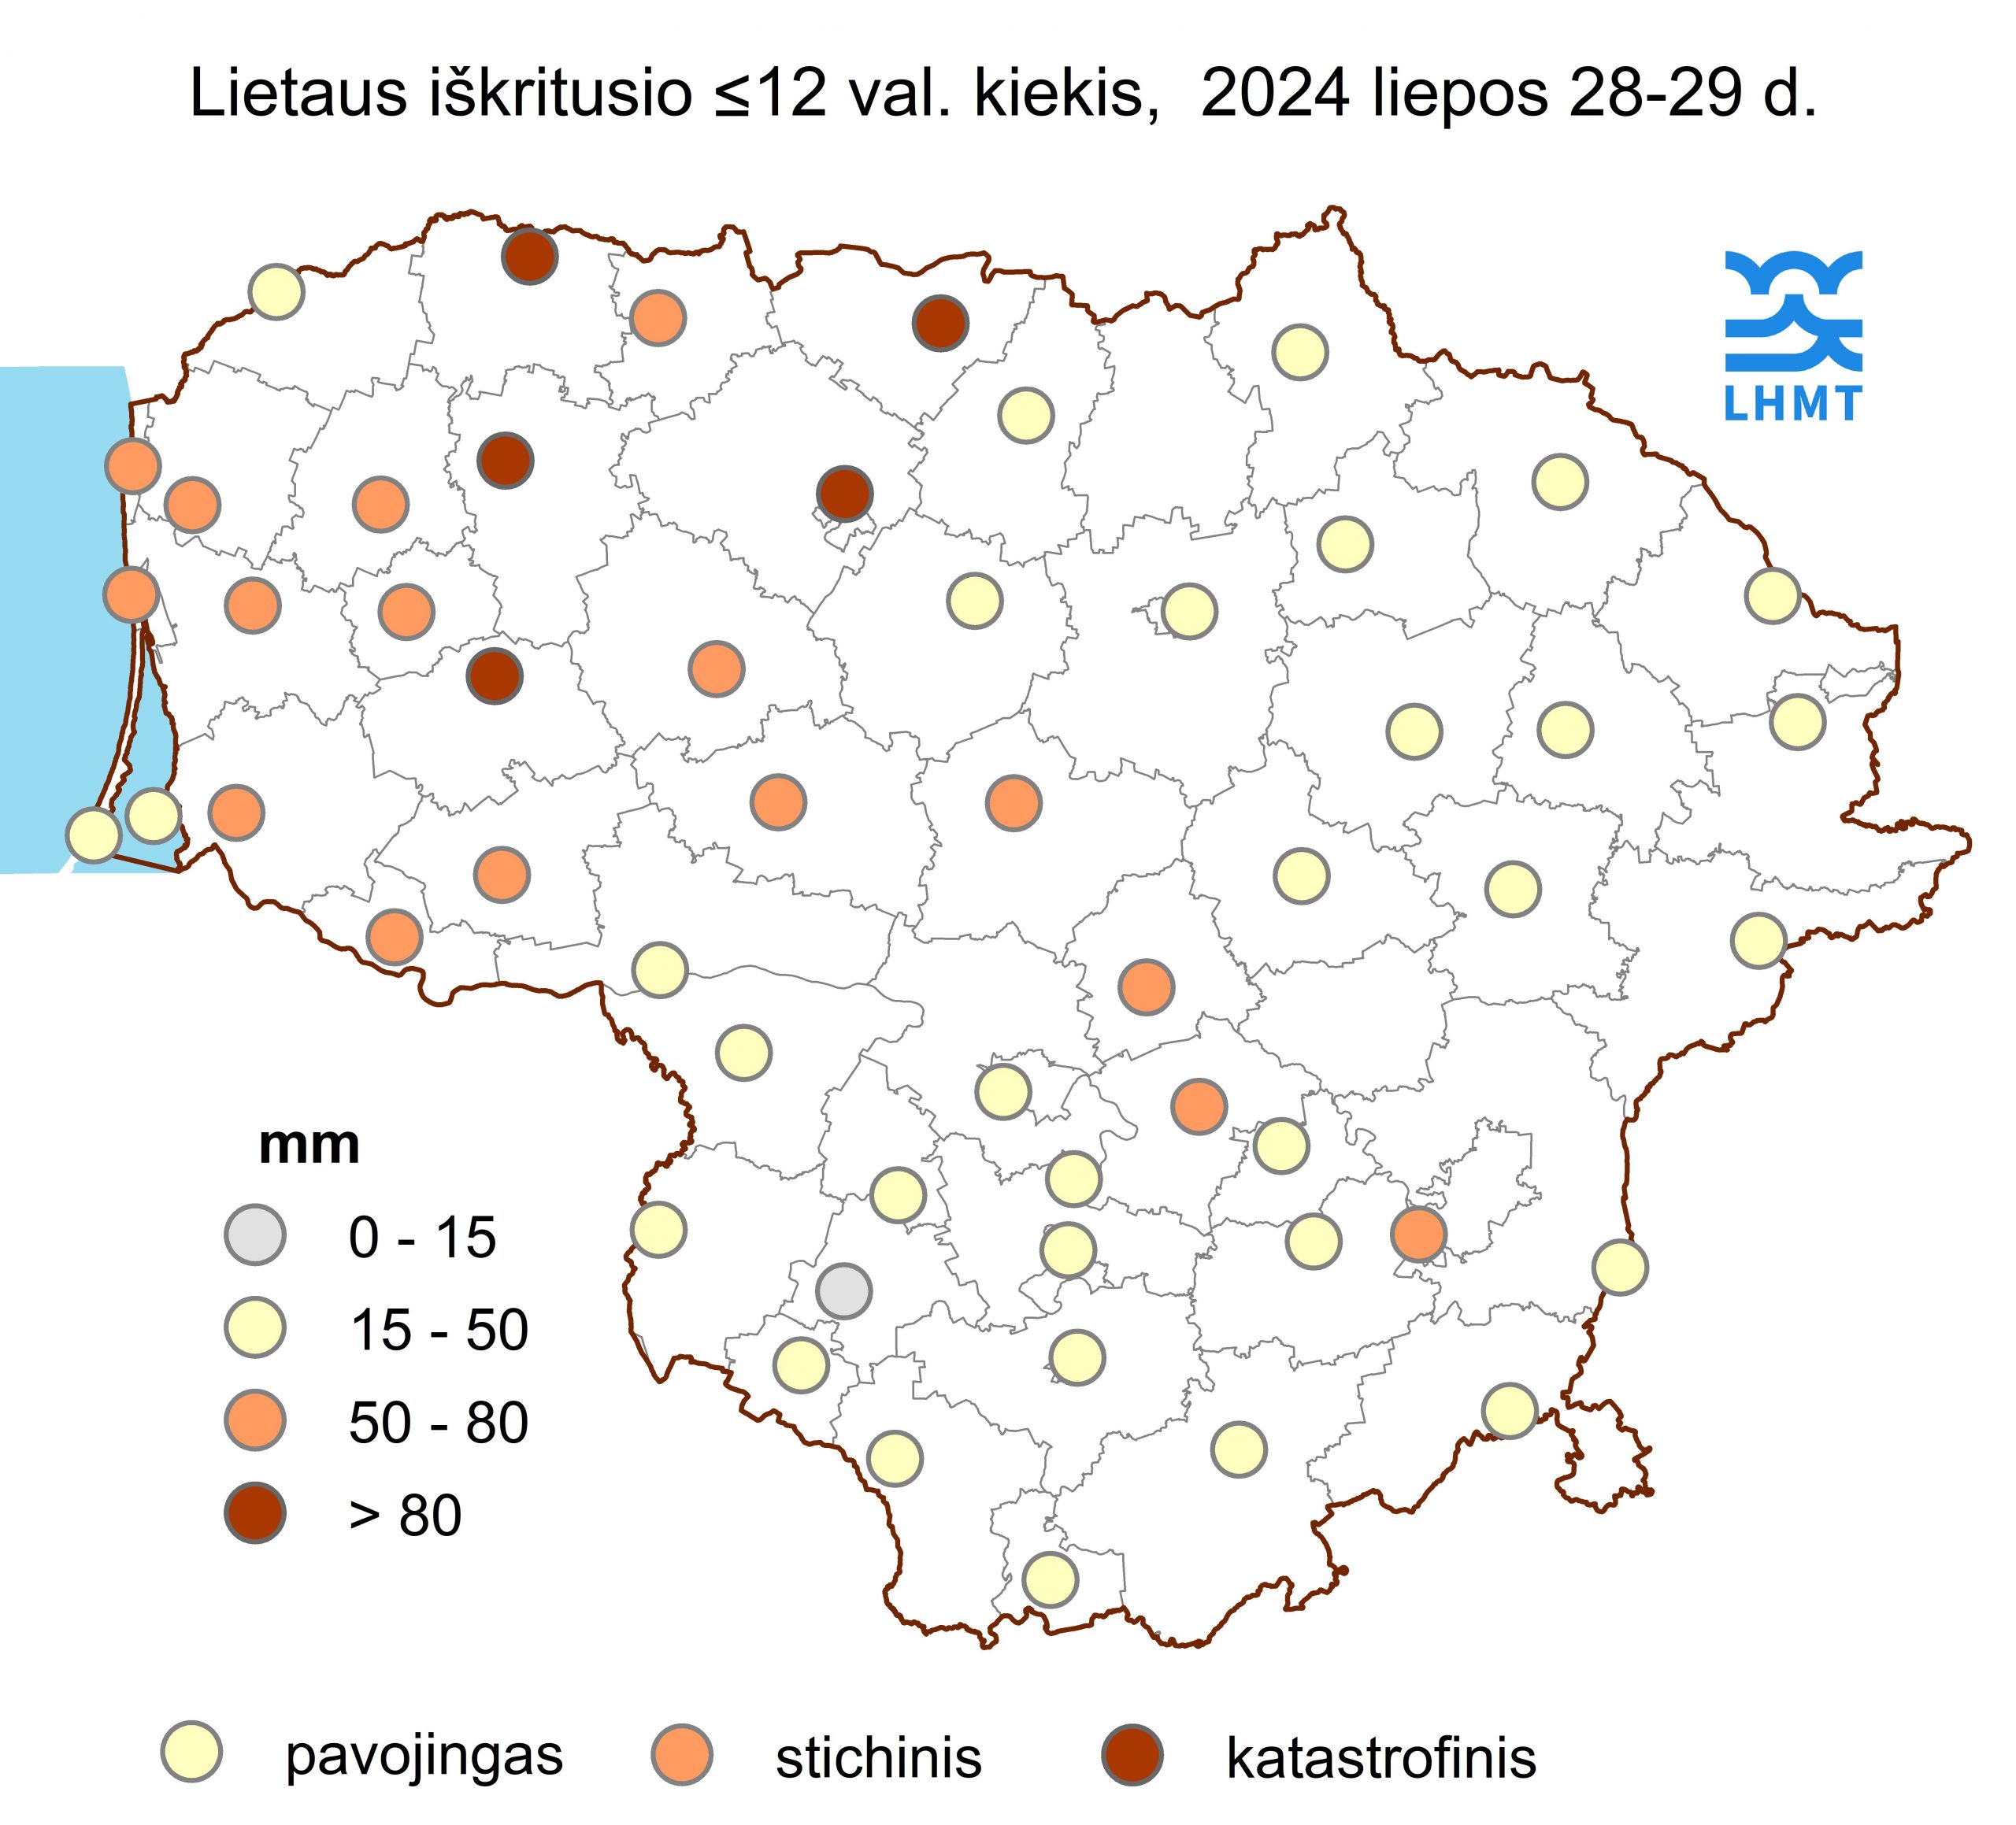
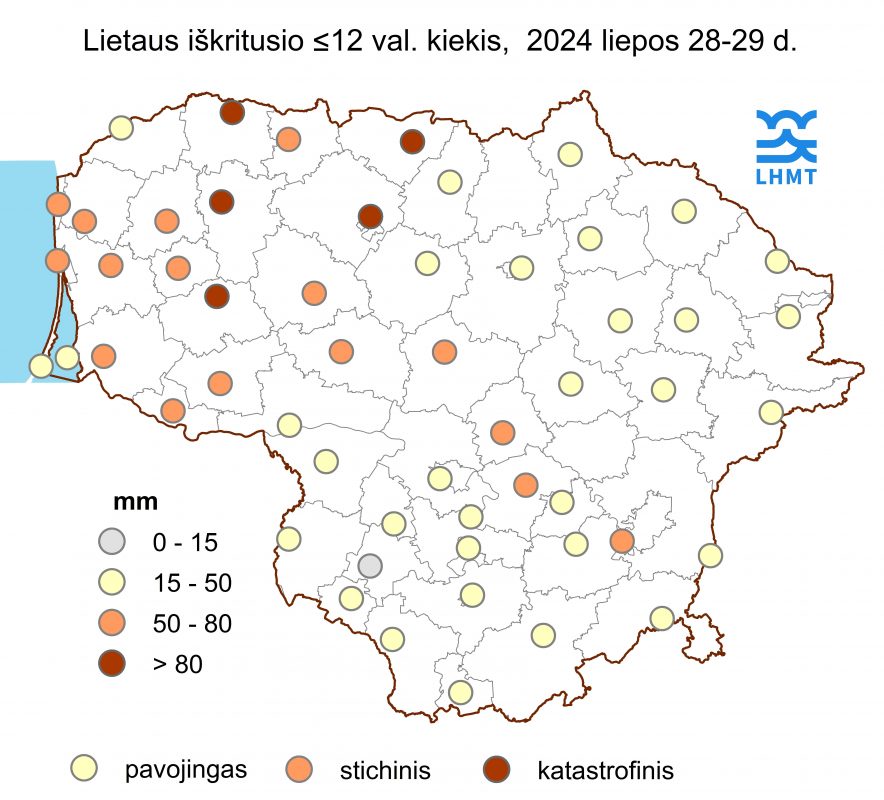
28-29 July It rained heavily in Lithuania. Very heavy rain fell at many stations of the Lithuanian Hydrometeorological Service (LHMS). Dangerous (15-49.9 mm, in ≤12 hours), severe (50-80 mm, in ≤12 hours) and catastrophic (>80 mm, in ≤12 hours) rains were recorded at all LHMS stations, except for Marijampolė AMS. The highest precipitation was recorded in Žemaitija and western part of Lithuania. Catastrophic rain was recorded at 5 meteorological stations: Telšiai (110.1 mm), Laukuva (97.3 mm), Šiauliai (93.1 mm), Joniškės (81.8 mm), Mažeikiai (80.7 mm). In 16 stations, cases of heavy rainfall were recorded.

The highest rainfall in Telšiai in a ≤12-hour period to date was 90.7 mm (1984) and 81 mm (1970) in Laukuva. Meanwhile, no catastrophic rainfall has ever been recorded in Šiauliai, Mažeikiai.

Cases of more than 100 mm of rainfall in less than 12 hours are extremely rare. Only a few such cases have been recorded in Lithuania since 1961: in 1961 in Žindaičiai (109.5 mm), in 1963 in Skuodas (113 mm), in 1980 in Sartai (200 mm), in 1985 in Aunuvėnai (110.6 mm), in Kyburi (111.7 mm) and in Pakruojis (115 mm), and in 2013 in Eidukai (104.7 mm) and in Kartėnai (118.2 mm).

Prepared by the Climate and Research Division

2024-05-22 | EUMETSAT representatives visited LHMS

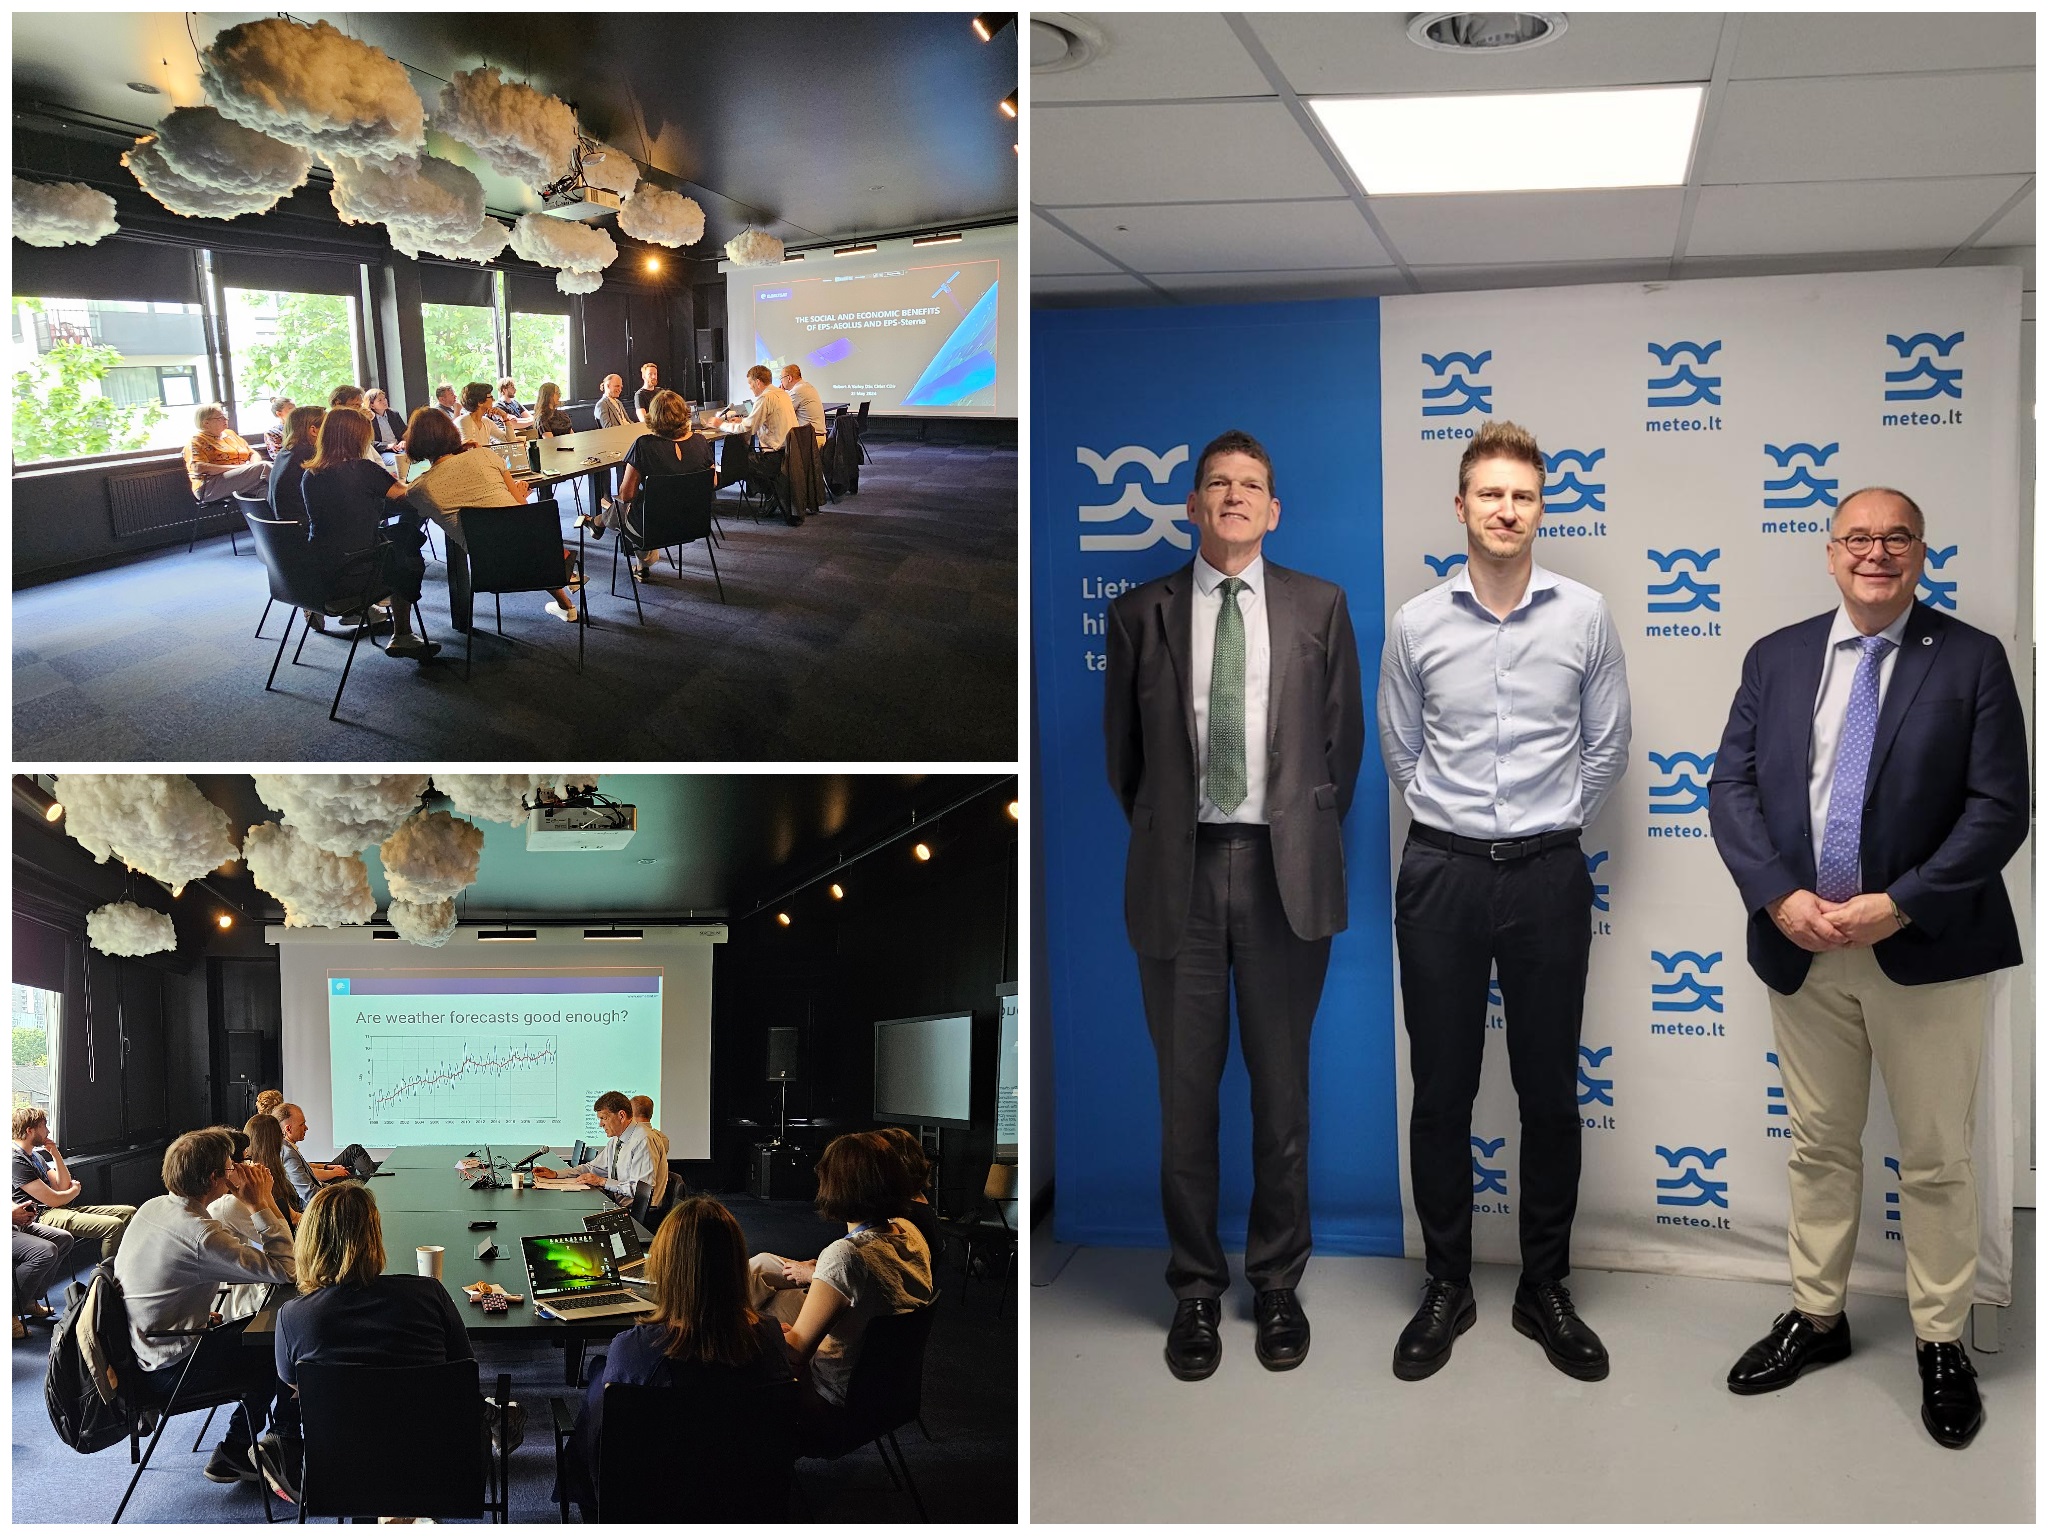
On 20-21 May, the LHMS was visited by guests from abroad. LHMS specialists had the opportunity to listen to several interesting presentations on foreign experiences and satellite measurements.

On 20th of May Meteorologist Robert Varley presented his work on developing a methodology for impact-based forecasts and warnings at the UK Met Office “Developing MHEWS in the Met Office”. They also visited and interacted with our country’s weather forecasters in the Forecasts and Warnings Division.

On 20th of May 10 A.M. In the LHMS auditorium, specialists not only from the Authority, but also from several other institutions of the country gathered to listen to the study “Socio-economic benefits of the EPS-Aeolus and EPS-Sterna second-generation satellites of the European polar orbiting satellite (EPS-Aeolus) and the EPS-Sterna second-generation satellites (EPS-Aeolus and EPS-Sterna satellites)”, presented by the representatives of the European Space Agency (EUMETSAT), Mr. Paul Counet and Mr Robert Varley. The socio-economic benefits (SEB) of delivering EPS-Aeolus and EPS-Sterna.) After the presentations, the representatives took a number of questions from the audience, which developed into a broader debate, so that the event even lasted a little longer than planned.

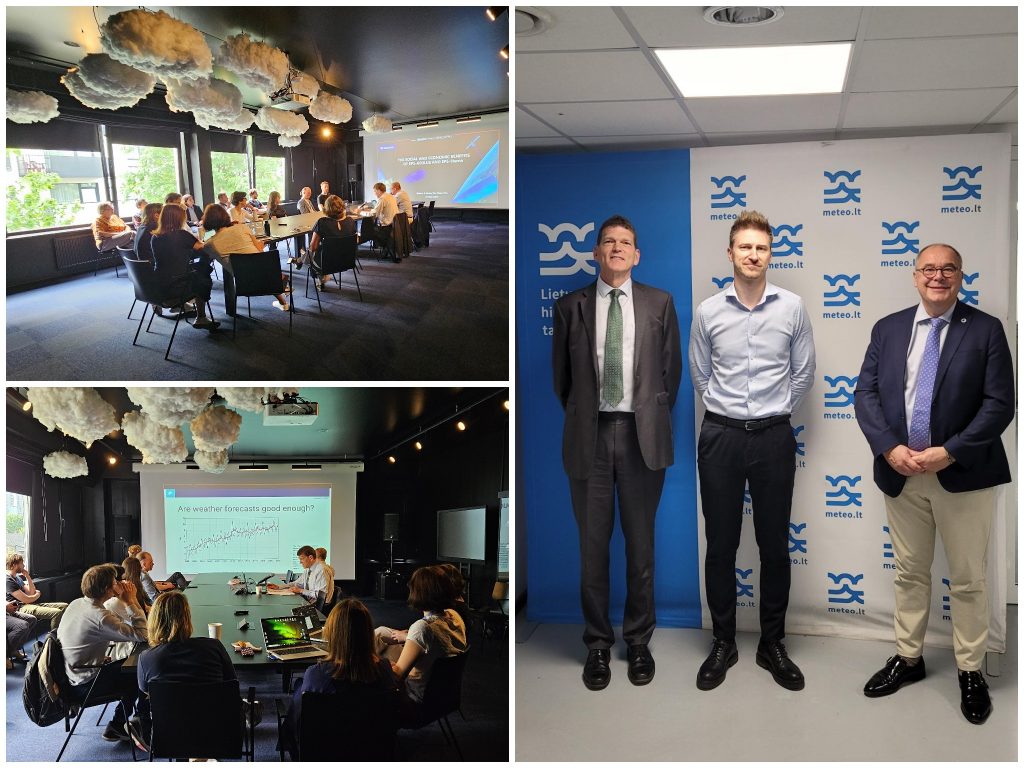
The photos on the left show some moments from the conference, which took place in the LHMT’s renovated meeting room. On the right (in order) – EUMETSAT’s Robert Varley, LHMS Director Ričardas Valančiauskas and another EUMETSAT representative Paul Counet.

2024-04-25 | This April’s rollercoaster of weather – a daily routine for the near future

By the end of the century, heatwaves and tropical nights are predicted to increase, the growing season will lengthen and cold days will decrease. Total annual precipitation is also projected to continue to increase from the current 684 mm to between 42 mm and 98 mm, especially in winter. Baltic Sea level rise will range from 22 cm to 35 cm.

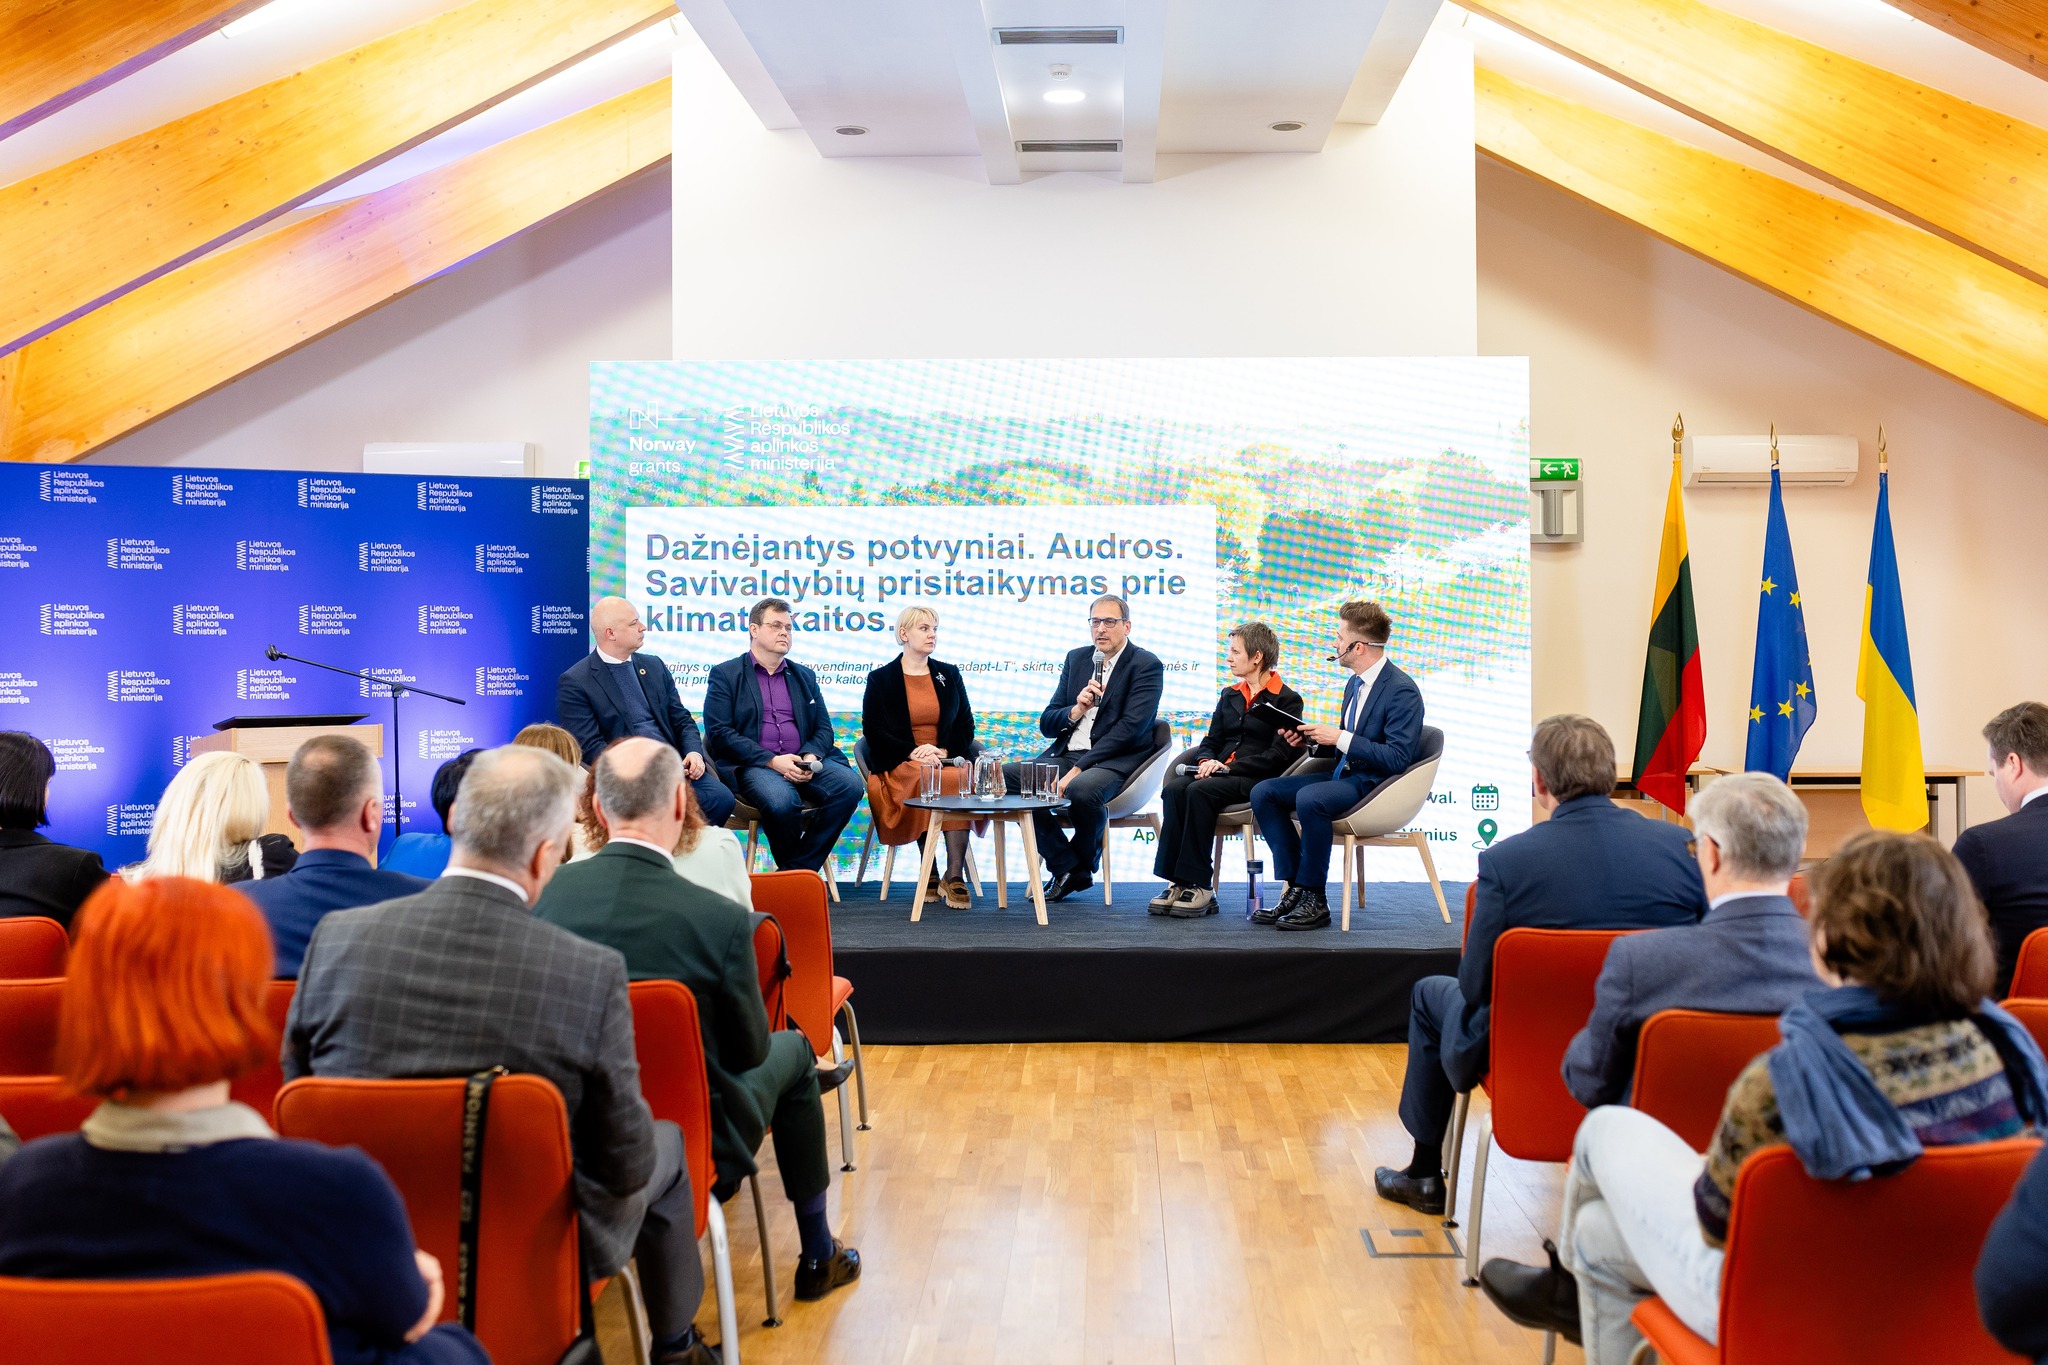
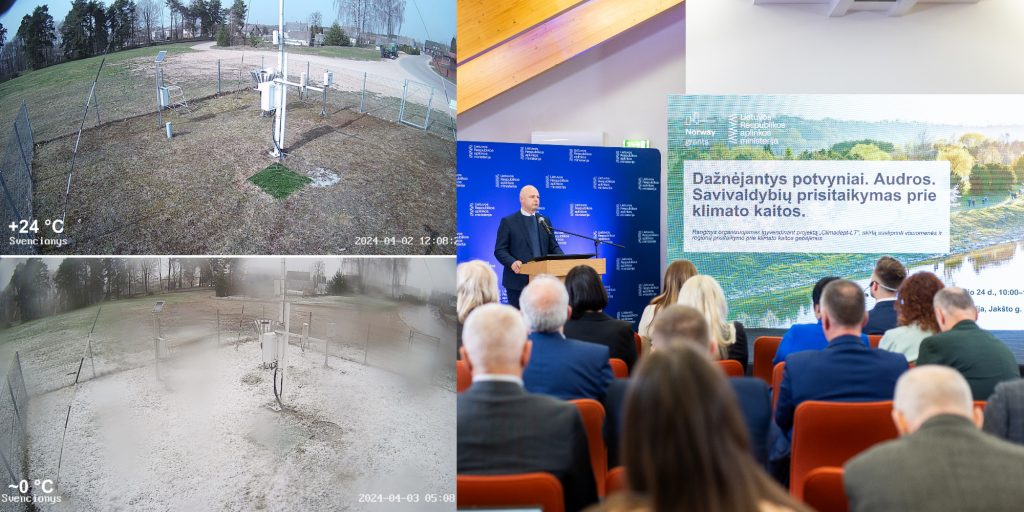
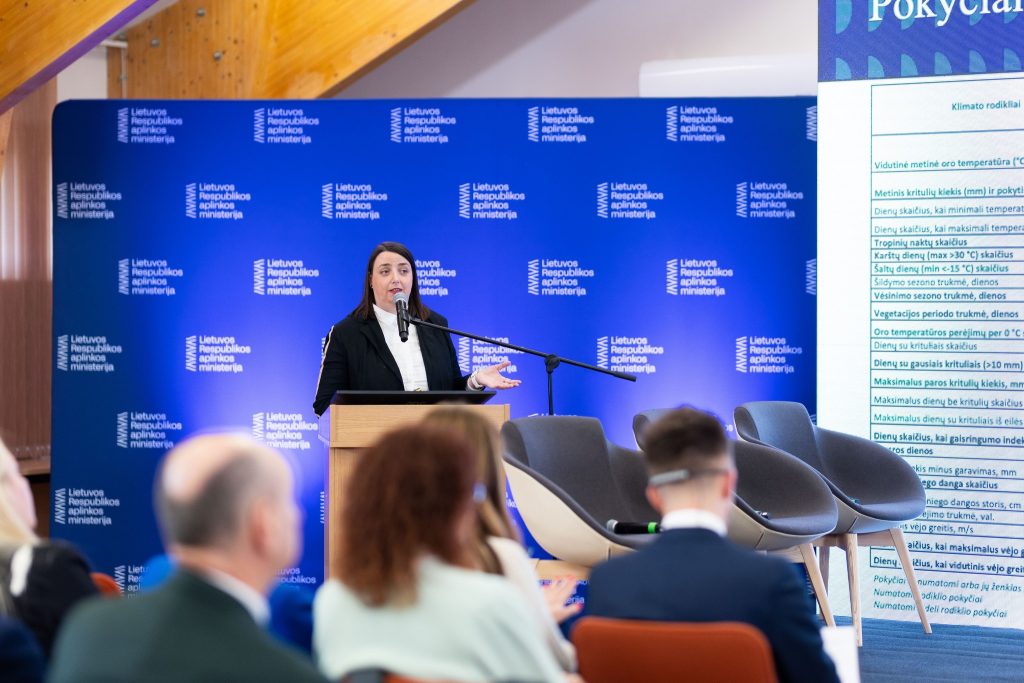
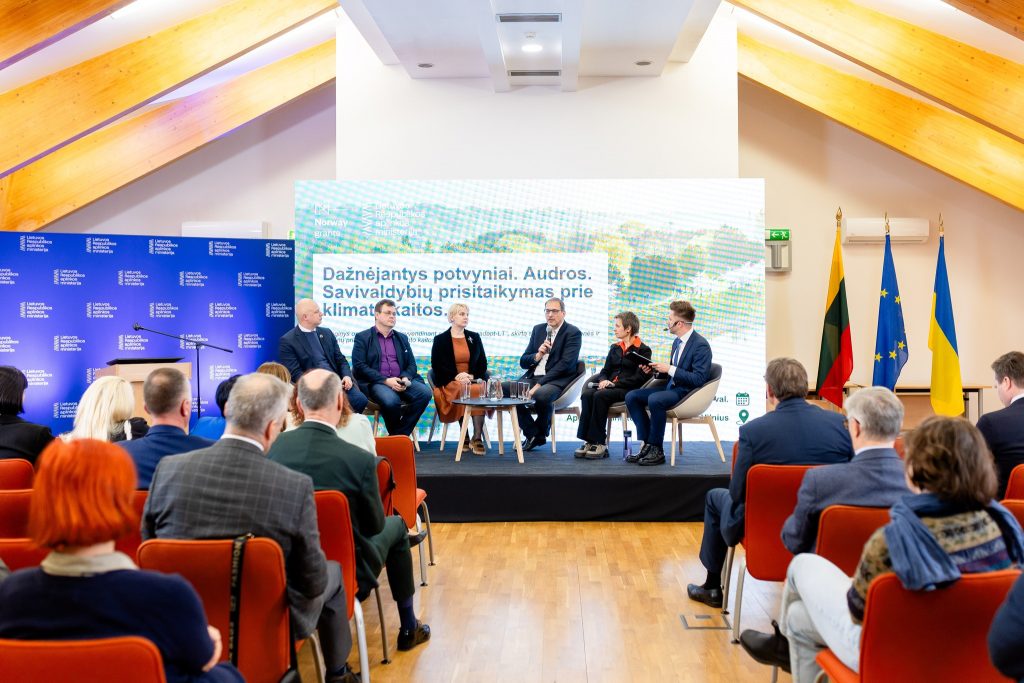
These climate projections for the next century were presented this Wednesday at the Ministry of the Environment’s event “Increasing floods. Storms. Adaptation of municipalities to climate change”.

“This decade is likely to have been the warmest in 125 000 years. The global average temperature   has risen by more than 1.5 °C   in the last 12 months.This year’s climate fluctuations in Lithuania reflect trends in climate change. In April, we had both record high temperatures and snow. In some places, the monthly precipitation rate fell in a single snowfall. Municipalities had to decide whether to put sand spreaders on the streets or to turn the heating back on,” said Judita Liukaitytė-Kukienė, Senior Adviser to the Climate Policy Group   at the Ministry of Environment.

“Today, we need to talk not only about mitigation but also about adaptation. Last year, floods in the coastal region and the collapse of sewage treatment plants caused losses of around €250 million. Yesterday, we saw how much snow there was in some places. We have already had ten heat records this year. This shows that there will be a crisis, and the question is whether we will be able to prepare for it, to protect the health of our people, our towns and cities, our nature, our roads, our energy sector, our agriculture. The flag of leadership must be waved by the local government, which will have to protect its citizens and focus on nature-based urban solutions,” said Simonas Gentvilas, Minister of the Environment.

According to Ms Liukaitytė-Kukienė, climate change is predicted to be responsible for 4 out of every 5 natural disasters and other global problems in the world over the next decade. In Lithuania, climate change is an integral part of the processes taking place in the globe’s climate system, and its effects   are being felt in our country as well.

In Lithuania, the average annual temperature has risen by 2.3 °C between 1961 and 2022. It is projected to rise by another 1 to 3 degrees in the future. The number of hot days, when the maximum daily   temperature reaches and exceeds 30 °C, has more than tripled, with an average of 5.8 days. The number of cold days, when the minimum daily air temperature drops to -20 °C and below, has almost halved, with an average of 10.5 days.

Annual precipitation increased by about 73 mm or 11% over the period, while the duration of sunshine increased by 7% or 127 hours.

All of the above   forecasts are based on the results of the ClimAdapt-LT project in Lithuania and Norway.

“We need   to think about how we are going to live our lives, how we are going to plan our daily activities so that the budgets of the state, municipalities and the population suffer as little damage as possible. The biggest changes are expected in winter, which will be much warmer, but we need to prepare for that too, because prolonged temperatures around zero are particularly damaging for roads, as it gets warmer and colder, and potholes form,” said J. Liukaitytė-Kukienė.

As average cold temperatures rise, people become less resilient to cold, which will increase the adverse health effects of cold. Although the number of cold days will decrease in winter, there will still be a need to change tyres and grit the streets. The number of heating days will decrease, but the thaws will be interspersed with cold snaps, as in April, when it was 29 degrees one week and 9 degrees the next, so heating systems need to be able to react flexibly to natural conditions.

There will also be a sharp rise in August temperatures and more heatwaves. We need to adapt our buildings to this. The southern region of Lithuania will be particularly affected by the heat, where temperatures will be high both day and night, and we will need to make sure that our buildings are cooled and air-conditioned so that people can rest.

There are also simple things that municipalities are already   doing to help people adapt to the heat, such as installing fountains and water columns in towns, but the network should be expanded. Schools should be renovated with heat recovery systems so that the education process does not have to be interrupted in extreme temperatures.

Nature is also giving us signals: ticks that spread disease are increasingly attacking, pine forests and spruce forests are suffering from pests, and allergies are on the rise. Parks and forests are being devastated by the abundance of rainfall, especially when a month’s worth of rain falls in a day. Heavy rains are replaced by dry spells, for which we must also be prepared, as the risk of fires increases. Climate change impacts are associated with increased mortality and cardiovascular morbidity in the future, as well as increasing heat stress and thermal discomfort. The healthcare system also needs to prepare for this.

Municipalities need to prepare individual plans with concrete actions. Our municipalities, though small, are very different. The Municipal Vulnerability Study prepared by ClimAdapt-LT identifies Kaunas, Klaipėda, Panevėžys, Šiauliai and Vilnius as the most vulnerable municipalities in 2100.

Klaipėda City Municipality, as one of the most vulnerable municipalities to climate change, has a Climate Change Adaptation Plan, which has been developed under the ClimAdapt-LT project, funded by the European Economic Area – Norway Grants Programme 2014-2021. The project has also developed plans for the municipalities of Panevėžys, Vilnius and Utena, Tauragė, Ukmergė, Birštonas and Varėna.  

To help municipalities predict future climate change and plan adaptation actions, the Ministry of the Environment has produced an interactive map and a lightbox to show how the climate will change in each Lithuanian municipality by 2100.

The board allows you to select optimistic or pessimistic climate change scenarios, time periods and forecast indicators to see the overall situation in Lithuania, and if you select a municipality of interest, you can see a summary of the forecast information based on the indicators for that territory of the country.

An interactive climate change map and a lightbox are available at www.klimatokaita.lt.

On 24 April, the conference “Increasing Floods. Storms. Municipal Adaptation to Climate Change.” Watch the video here.

Ministry of the Environment press release

2024-04-23 | Latvian and Lithuanian experts launch joint project “ICEREG

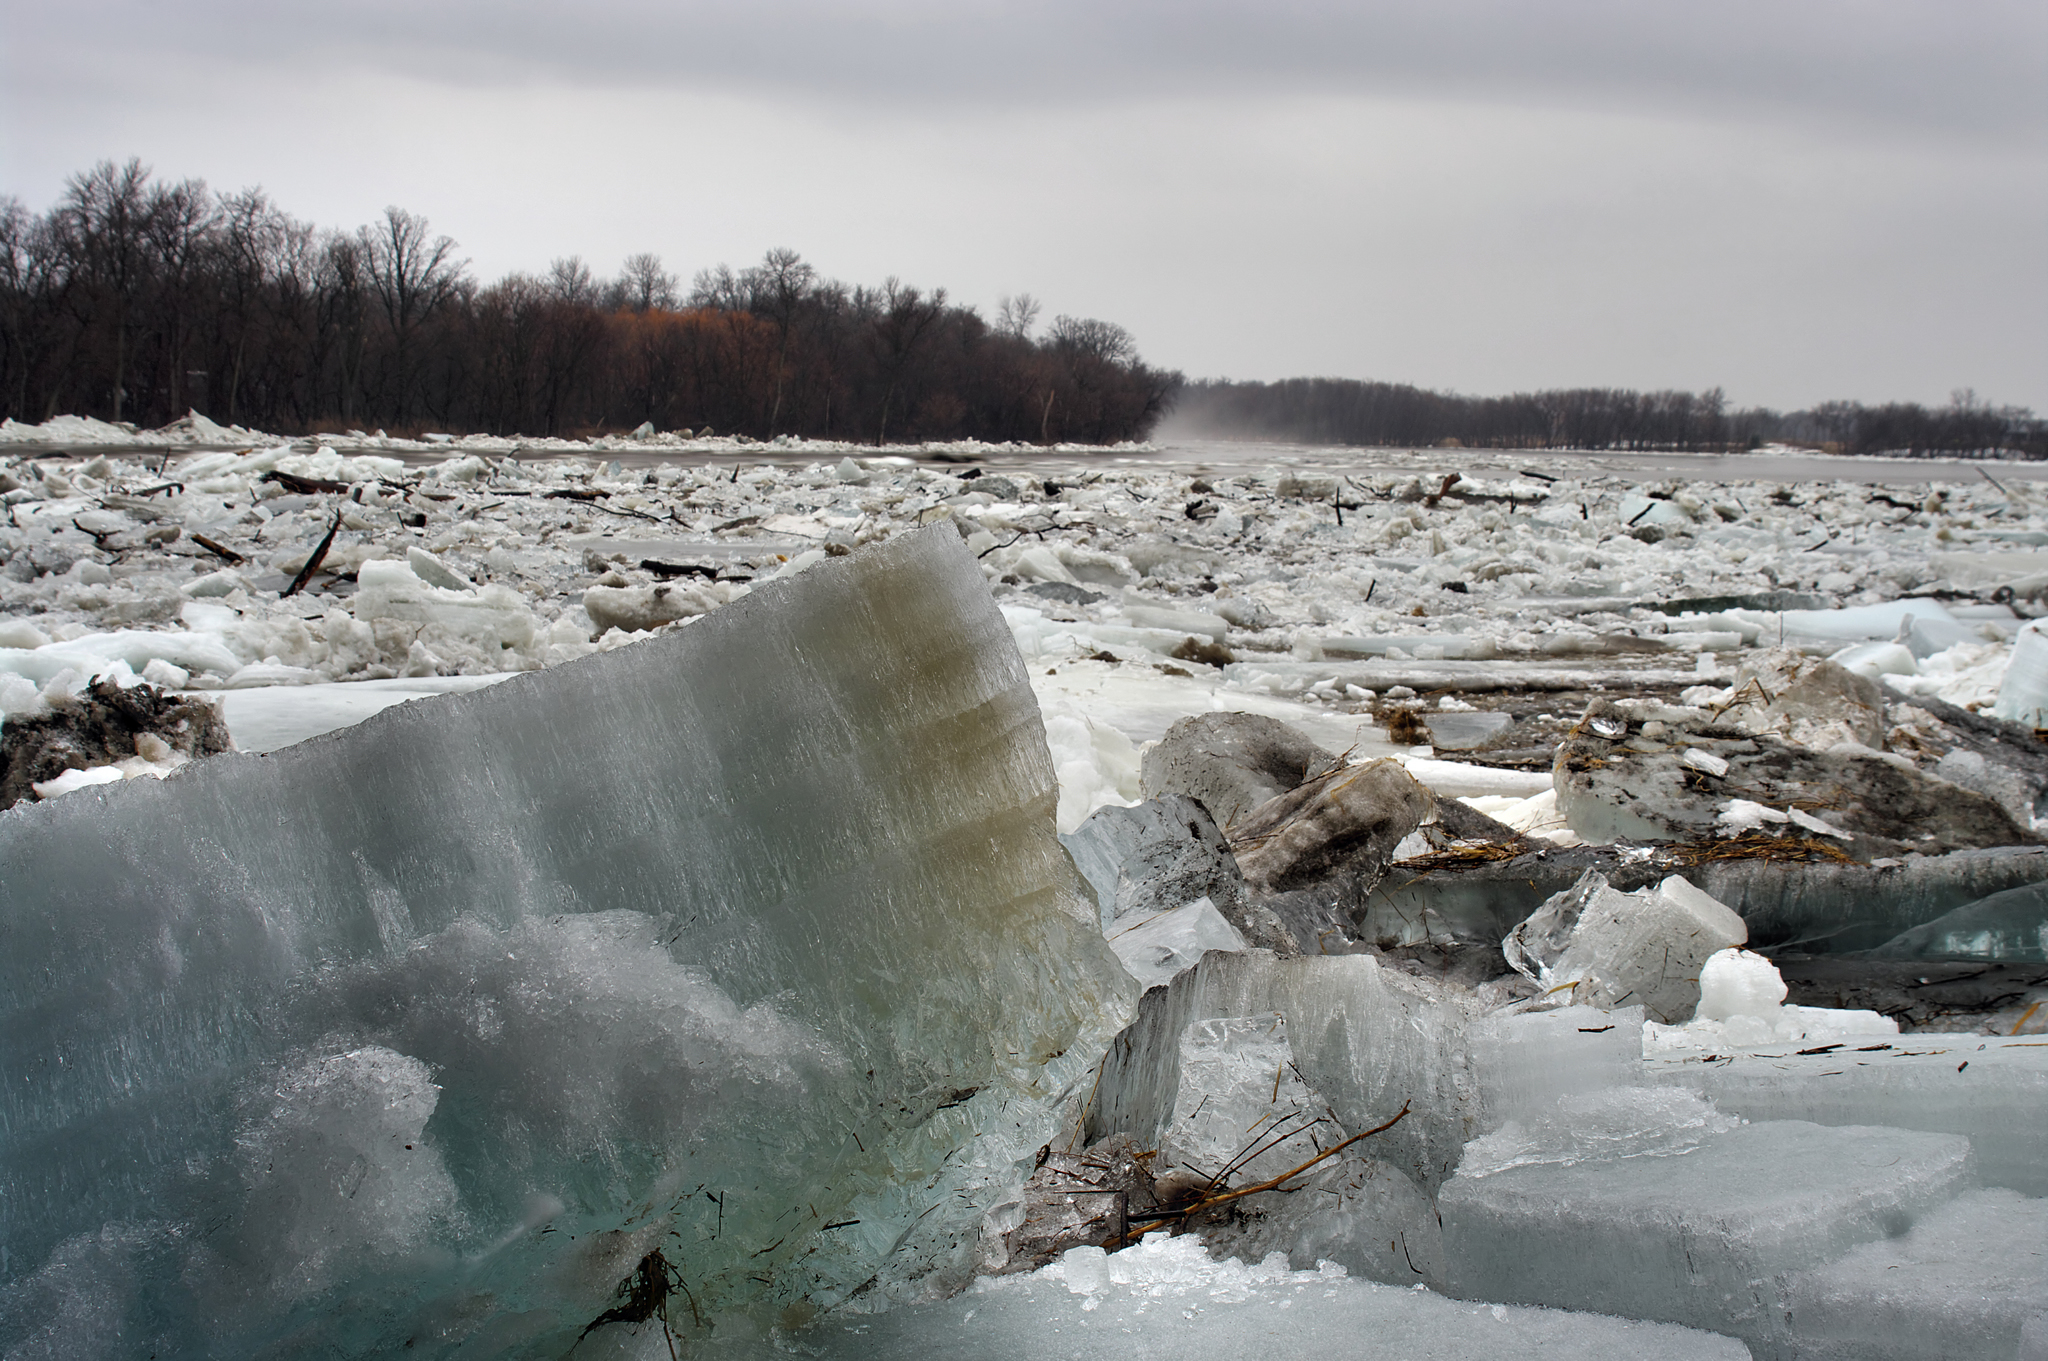
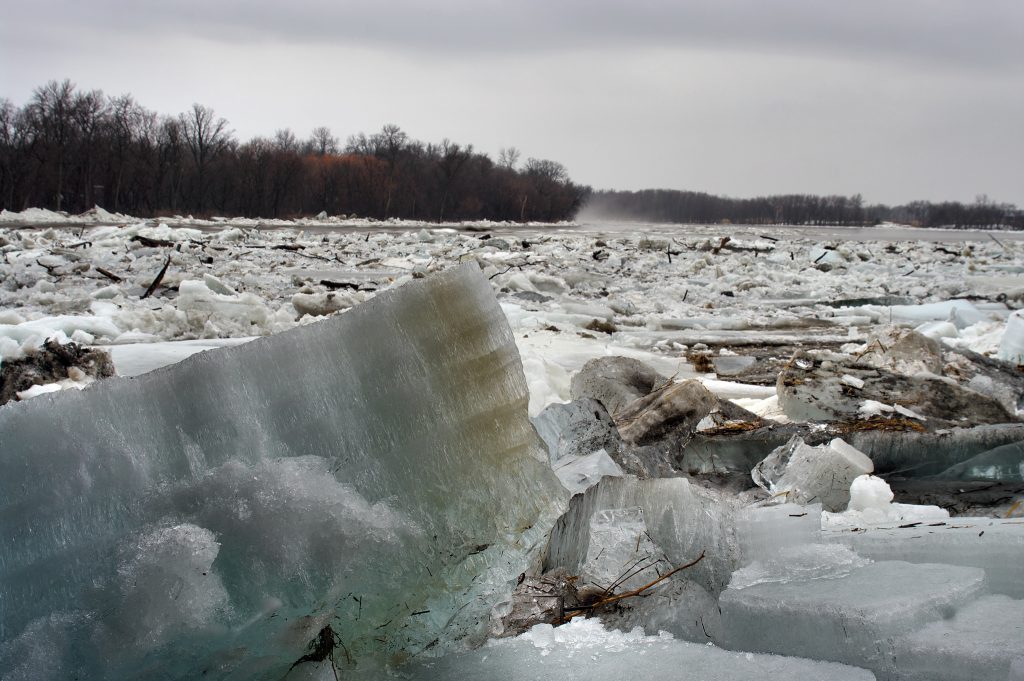
In 2010, the Lithuanian economy suffered €2.8 million in damages as a result of ice drifts on Lithuanian rivers and rising floodwaters. Last year, a 30-kilometre-long ice jam on the Daugava River near Jekabpils in Latvia cost the Latvian economy around €2.5 million.

Hoping to help prevent millions of euros in losses, Latvian and Lithuanian scientists have embarked on a joint project called “ICEREG – Managing the risk of ice drift flooding in Latvia and Lithuania under a changing climate”. The project, which started on 9 March this year, aims to improve the management of ice drift flood risk by developing detailed flood maps and improving the conceptual model of ice drift formation, especially in the context of climate change.

Ice drifts – an unpredictable phenomenon 

Motivating the expediency of such a study, Jūratė Kriaučiūnienė, Ph.D., representative of the project at the Lithuanian Energy Institute, Head of the Hydrology Laboratory, points out that in Lithuania, floods are mostly caused by melting snow and ice (about 70-75% of the cases), heavy rainfall (about 15%) and rising of the level of the water level in the Baltic Sea, faulty operation of the dams and accidents (about 15%). 

“With today’s technology, the onset and magnitude of a snowmelt flood can already be predicted quite accurately a week or two in advance. In contrast, floods caused by ice drifts are completely unpredictable: in such cases, the speed of the water level rise is determined by hours, not days,” Kriaučiūnienė emphasises.  

Although both Latvia and Lithuania have already included the reduction and management of snowmelt and flash flood risks in their climate change adaptation plans, the dynamics of ice drifts are still understudied. And ice drifts, as an additional source of flood risk, pose an ominous risk of potentially massive flooding and damage – both to the communities of the border regions of both countries in particular and to the economies of the countries in general.  

Dr. J. Kriaučiūnienė adds that “currently existing flood risk maps do not provide a detailed assessment of the risks posed by ice drifts, as both Lithuania and Latvia do not yet have numerical models that could assess the formation, prediction and risk of such floods”.

And the risks are huge. Recalling the 2010 flood, Dr Vytautas Akstinas, a senior researcher at the Hydrology Laboratory and an expert in hydromorphology for this project, cites some really unpleasant statistics: “The flood caused by the ice drifts affected an area of 40,000 hectares. The municipalities of Šilutė, Pagėgiai, Kaunas, Panevėžys, Jonava and Joniškis suffered damage. In the Nemunas delta alone, 35 000 hectares were flooded. Residents and their property, businesses, agricultural companies, roads, etc. were affected.”

The expert recognises that flooding can change in two directions as the climate changes. “One of the two main prevailing views is that the risk of ice sheet flooding will decrease simply because of rising air temperatures, which will lead to less ice formation and more melting of the ice. The opposite hypothesis emphasises the danger of floods becoming more extreme and unexpected – that a society accustomed to floods may relax a little too much and ignore the real threats. This relaxation and lack of preparedness for an emergency could be even more dangerous than the more frequent ice drift floods”, says Akstinas.

Dr Kriaučiūnienė agrees with her colleague on the relaxation of people: ‘We can observe people’s negligence or carelessness even now. For example, when choosing a place to live, people try very hard to settle as close to the river as possible. If you try to draw their attention to the danger of flooding, they often wave their hands and say, ‘People have been living here for 20 years and there have been no floods. Then they build a house there, the flood inundates them and their territory, and then they complain that the insurance doesn’t compensate them”, smiles the hydrologist.

ICEREG project progress and practical benefits 

Among other benefits, the ICEREG project will also be useful for people who are more responsible in their choice of place to live. A special map will be drawn up and published on the website of the Lithuanian Hydrometeorological Service, highlighting areas at higher risk of ice drift flooding. However, the map will initially not cover the whole of Lithuania.

“In this particular project, we will analyse the river basins of the northern Lithuanian rivers (Venta, Mūša, Lėvens) and the southern Latvian rivers. However, the project will develop a methodology that will allow us to analyse the basins of all other Lithuanian rivers, if necessary,” says Dr. J. Kriaučiūnienė.

The project, to be completed in 2026, will model and map the most vulnerable areas to ice drifts in Latvia and Lithuania. “First, we will analyse historical data in the rivers of Northern Lithuania and identify the sections of the two rivers that pose the greatest risk to the population,” Akstinas briefly outlines the project. “We will then carry out modelling work on the selected river stretches to assess the different probabilities of ice drifts and how they may affect the surrounding areas and the population. In other words, a generic analysis that will allow us to identify problem areas and assess how dangerous they are for the public,” concludes the hydromorphology expert.

Kriaučiūnienė mentions her colleagues from the Finnish Environment Institute (SYKE) in a special word: “In the ICEREG project, we will use a numerical model of ice drift formation developed by SYKE scientists in Finland, integrated with the HEC-RAS hydrodynamic model. The ice drift model is, of course, tailored for Finnish rivers, so we will have to adapt the model to Lithuanian conditions by filling it with our own data and calibrating it to give the right results for our rivers. Our Finnish colleagues have not only agreed to share their model, but also to train us in all its possibilities,” said Ms Kriaučiūnienė.  

Once the hydrometeorological data has been compiled and the calculations are in line with historical, actual flood results, it will be possible to make predictions for the future: to study different climate change scenarios, to study changes in temperature and precipitation, and to look at the potential for the formation of ice drifts, even if it is hundreds of years in the future.

The model developed by the ICEREG project will be used to improve the current early warning system by including information on ice drift flooding. Successful implementation of the project should not only increase the safety of regions facing these problems, but also reduce potential economic damage.  

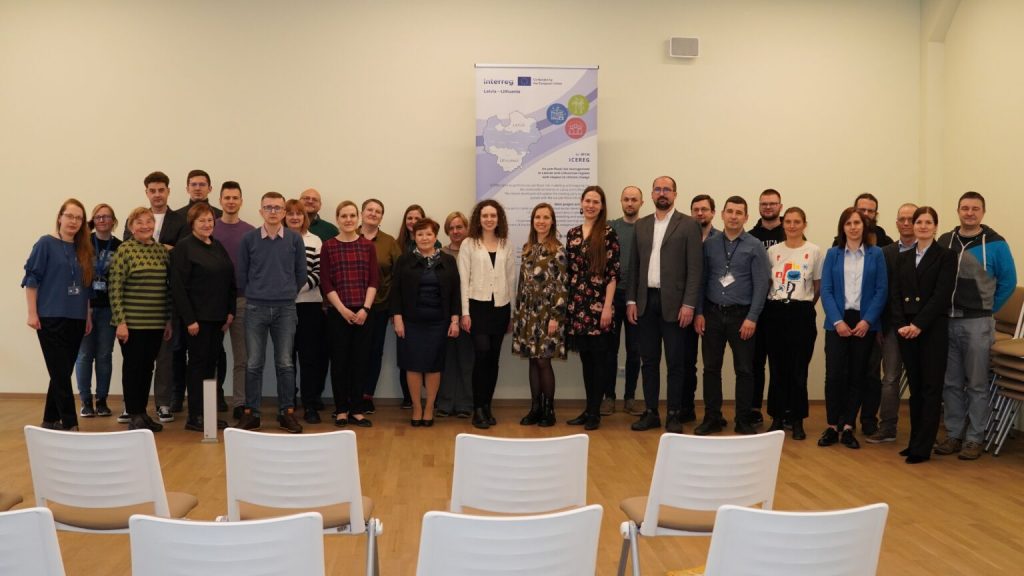
Pictured here on 3 April. The project kick-off meeting took place in Riga, bringing together representatives of the three organisations involved in the project.


The ICEREG project, led by the Latvian Centre for Environment, Geology and Meteorology, involves the Lithuanian Energy Institute and the Lithuanian Hydrometeorological Service under the Ministry of Environment

Co-funded by the European Union. The total project budget is EUR 654 082.50.   Co-financing from the European Regional Development Fund – EUR 523 266.00.

This article has been produced with financial support from the European Union. The content of this article is the sole responsibility of the Lithuanian Energy Institute and does not necessarily reflect the views of the European Union.
2024-04-22 | Project “Implementation of the activities of the National EuroHPC Partnership Centre of Excellence”

Vilnius University (Faculty of Physics and Faculty of Mathematics and Informatics) together with partners Kaunas University of Technology, Vilnius Gediminas Technical University, Lithuanian Hydrometeorological Service under the Ministry of Environment is implementing the project “Implementation of the activities of the National EuroHPC Partnership Centre of Excellence”.

The aim of the project is to strengthen competences in supercomputing (HPC), high-performance data processing (HPDA) and artificial intelligence (AI) in Lithuania, to foster their use in industry and research, and to develop interdisciplinary collaborations between universities, companies and government institutions.

The duration of the project is from 1 January 2023 to 31 December 2025. The total value of the project is EUR 1 000 018,68.

The project is co-funded by the EU Funds Investment Programme for the period 2021-2027 (Contract No. 10-051-P-0001) and the European Joint Undertaking on High-Performance Computing (contract No. 101101903).

2024-04-19 | ECMWF representatives visited LHMS

On 18 April distinguished guests visited LHMS Our service was visited by speakers from the European Centre for Medium-Range Weather Forecasts (ECMWF Liaison Group), as well as meteorologists from the Department of Hydrology and Climatology of Vilnius University.

Throughout the day, there were six different presentations. Stijn Vermoote (Head of ECMWF’s User Outreach and Involvement Unit) gave an overview presentation on ECMWF’s strategy, ongoing updates and the Copernicus programme. After a short break, ECMWF analyst Ervin Zsoter presented the ECMWF products available for precipitation and hazardous weather forecasts. He also provided information about EFAS and GloFAS (European and Global Flood Awareness Systems) and their benefits and challenges. Emma Pidduck (ECMWF Data Policy and Partnerships Coordinator) talked about ECMWF’s efforts to migrate the output of its daily calculation data from the GRIB version 1 file format to GRIB version 2, which is much more advanced than the old one. Tim Stockdale (Chief Scientist, Research Unit) gave a presentation on seasonal-long-term forecasts.

In a series of presentations, LHMT experts and other audience members, both live and remotely, saw that in spite of the various challenges, ECMWF processes and models continue to evolve, and that the near future is promising as well.

Photos show some of the highlights of the conference, which took place in the renovated LHMT meeting room ☁