Climate describes the perennial weather patterns of an area, their typical changes, and the daily and annual variations in weather. Various climate indices are used to measure changes in climate, summarising meteorological information and allowing comparisons of climate in different parts of the world. Below are some climate indices that reflect the changes taking place in Lithuania.
Lithuania, like the rest of the world, has been experiencing a rise in average air temperature since 1961. The number of warm summer days with maximum temperatures above 25 °C has increased significantly (Figure 1).
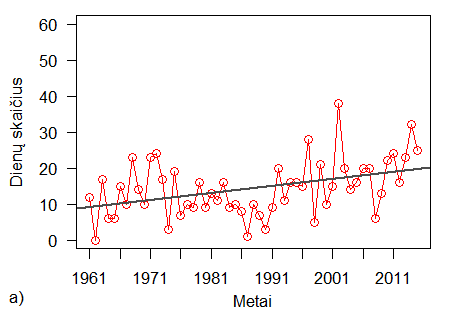
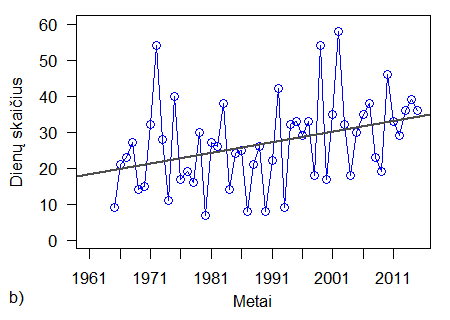
Figure 1 Number of summer days (number of days per year with Tmax > 25 °C): a) in Klaipėda; b) in Vilnius.
Tropical nights are also increasingly common in our country, with temperatures not dropping below 20ºC even in the coldest hours of the night (Figure 2). Until 1990 tropical nights were very rare in Lithuania, and some meteorological stations did not record such nights at all.
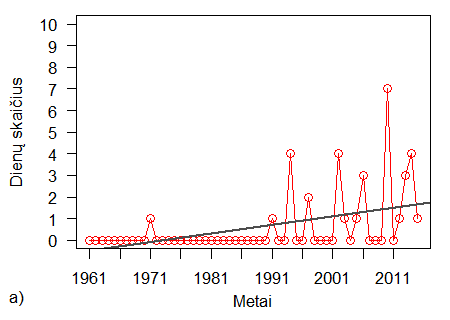
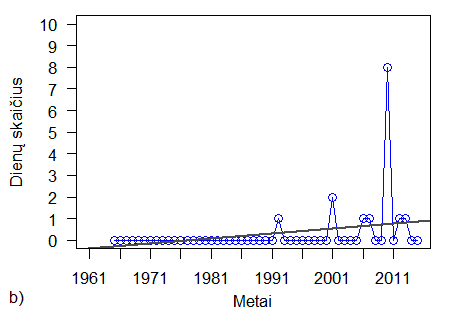
Figure 2 Number of tropical nights (Tmin ≥ 20 °C): a) in Klaipėda; b) in Vilnius.
As the average air temperature rises, the number of days with freezing temperatures decreases during the cold season (Figure 3).
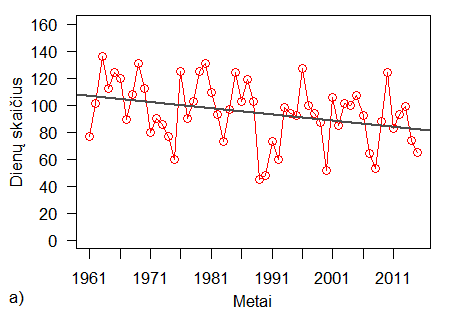
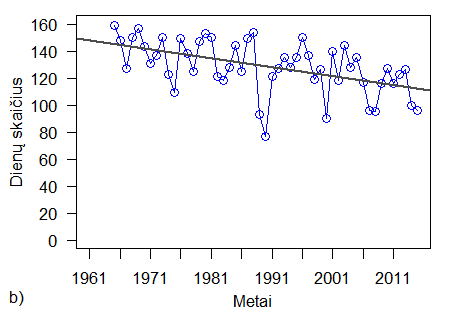
Figure 3. Days with temperatures below 0°C: a) in Klaipėda; b) in Vilnius.
Not only are air temperatures changing, but also the amount and distribution of precipitation. In Lithuania, annual rainfall varies only slightly, but intensive rainfall events are on the increase, with daily rainfall of 20 mm or more. (Fig 4.)
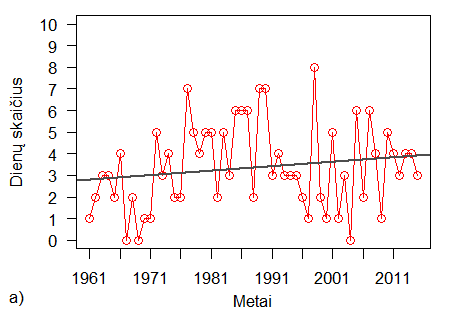
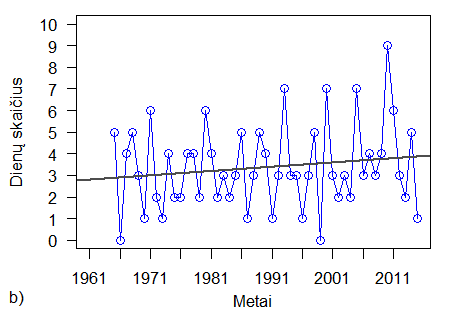
Figure 4 Number of days per year with daily precipitation ≥ 20 mm: a) in Klaipėda; b) in Vilnius.
The climate change trends observed in Lithuania mirror changes in climate change around the world. Global average temperature since the end of 19th century has risen by 0.85 °C, there are changes in the water cycle some regions becoming drier and others wetter. You can read more about climate change here.